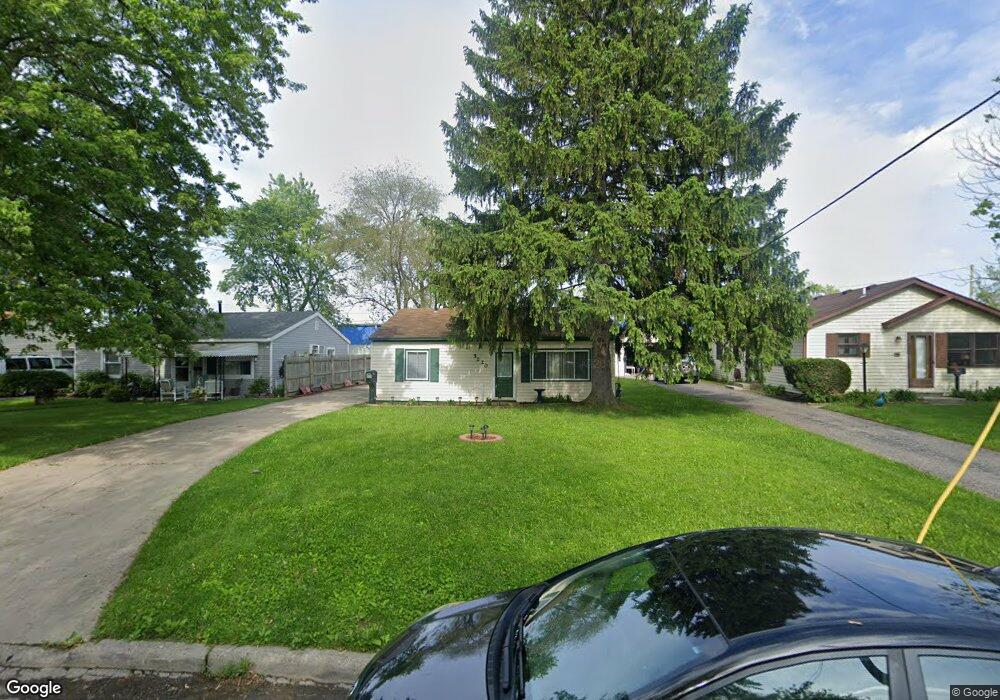
5220 Spicer Rd Toledo, OH 43612
North Towne NeighborhoodEstimated Value: $113,630 - $120,000
3
Beds
1
Bath
957
Sq Ft
$123/Sq Ft
Est. Value
About This Home
This home is located at 5220 Spicer Rd, Toledo, OH 43612 and is currently estimated at $118,158, approximately $123 per square foot. 5220 Spicer Rd is a home located in Lucas County with nearby schools including Larchmont Elementary School, Start High School, and Bennett Venture Academy.
Ownership History
Date
Name
Owned For
Owner Type
Purchase Details
Closed on
Feb 10, 2025
Sold by
Eisenmann Douglas A and Eisenmann Doug
Bought by
Greater Metropolitan Title
Current Estimated Value
Purchase Details
Closed on
Jan 27, 2003
Sold by
Williams Troy D and Williams Michelle K
Bought by
Eisenmann Douglas
Purchase Details
Closed on
Oct 5, 1998
Sold by
Williams Troy D and Williams Michelle K
Bought by
Williams Troy D and Williams Michelle K
Home Financials for this Owner
Home Financials are based on the most recent Mortgage that was taken out on this home.
Original Mortgage
$64,000
Interest Rate
6.97%
Purchase Details
Closed on
Jul 24, 1996
Sold by
Wulf Stephen J
Bought by
Williams Troy D and Cater Michelle K
Home Financials for this Owner
Home Financials are based on the most recent Mortgage that was taken out on this home.
Original Mortgage
$50,487
Interest Rate
8.43%
Mortgage Type
New Conventional
Purchase Details
Closed on
Jun 10, 1992
Sold by
Wulf Stanley A and Wulf Barbara #
Purchase Details
Closed on
Dec 17, 1990
Sold by
Mclaney A E and D E
Create a Home Valuation Report for This Property
The Home Valuation Report is an in-depth analysis detailing your home's value as well as a comparison with similar homes in the area
Home Values in the Area
Average Home Value in this Area
Purchase History
| Date | Buyer | Sale Price | Title Company |
|---|---|---|---|
| Greater Metropolitan Title | -- | None Listed On Document | |
| Eisenmann Douglas | $61,733 | -- | |
| Williams Troy D | -- | First Service Title Agency I | |
| Williams Troy D | $53,500 | -- | |
| -- | $39,500 | -- | |
| -- | $32,000 | -- |
Source: Public Records
Mortgage History
| Date | Status | Borrower | Loan Amount |
|---|---|---|---|
| Previous Owner | Williams Troy D | $64,000 | |
| Previous Owner | Williams Troy D | $50,487 |
Source: Public Records
Tax History Compared to Growth
Tax History
| Year | Tax Paid | Tax Assessment Tax Assessment Total Assessment is a certain percentage of the fair market value that is determined by local assessors to be the total taxable value of land and additions on the property. | Land | Improvement |
|---|---|---|---|---|
| 2024 | $830 | $25,865 | $7,140 | $18,725 |
| 2023 | $1,323 | $19,320 | $5,600 | $13,720 |
| 2022 | $1,324 | $19,320 | $5,600 | $13,720 |
| 2021 | $1,350 | $19,320 | $5,600 | $13,720 |
| 2020 | $1,294 | $16,100 | $4,655 | $11,445 |
| 2019 | $1,255 | $16,100 | $4,655 | $11,445 |
| 2018 | $1,468 | $19,075 | $4,655 | $14,420 |
| 2017 | $1,501 | $18,655 | $4,550 | $14,105 |
| 2016 | $1,505 | $53,300 | $13,000 | $40,300 |
| 2015 | $1,494 | $53,300 | $13,000 | $40,300 |
| 2014 | $1,206 | $18,660 | $4,550 | $14,110 |
| 2013 | $1,206 | $18,660 | $4,550 | $14,110 |
Source: Public Records
Map
Nearby Homes
- 414 Boxhall Rd
- 331 Southdale Rd
- 702 Mayfair Blvd
- 303 W Crawford Ave
- 431 Northdale Dr
- 223 Northdale Dr
- 451 W Crawford Ave
- 420 Northdale Dr
- 741 Cloverdale Rd
- 314 W Poinsetta Ave
- 606 W Capistrano Ave
- 5542 Ashdale Ct
- 423 W Poinsetta Ave
- 5559 Sunnyside Dr
- 434 W Gramercy Ave
- 446 W Gramercy Ave
- 23 W Capistrano Ave
- 918 Mayfair Blvd
- 5454 San Pedro Dr
- 307 California Blvd
- 5214 Spicer Rd
- 5224 Spicer Rd
- 5210 Spicer Rd
- 5230 Spicer Rd
- 5234 Spicer Rd
- 5204 Spicer Rd
- 402 Waybridge Rd
- 407 Mayfair Blvd
- 5240 Spicer Rd
- 408 Waybridge Rd
- 415 Mayfair Blvd
- 5244 Spicer Rd
- 414 Waybridge Rd
- 402 Mayfair Blvd
- 401 Waybridge Rd
- 419 Mayfair Blvd
- 408 Mayfair Blvd
- 5250 Spicer Rd
- 405 Waybridge Rd
- 420 Waybridge Rd