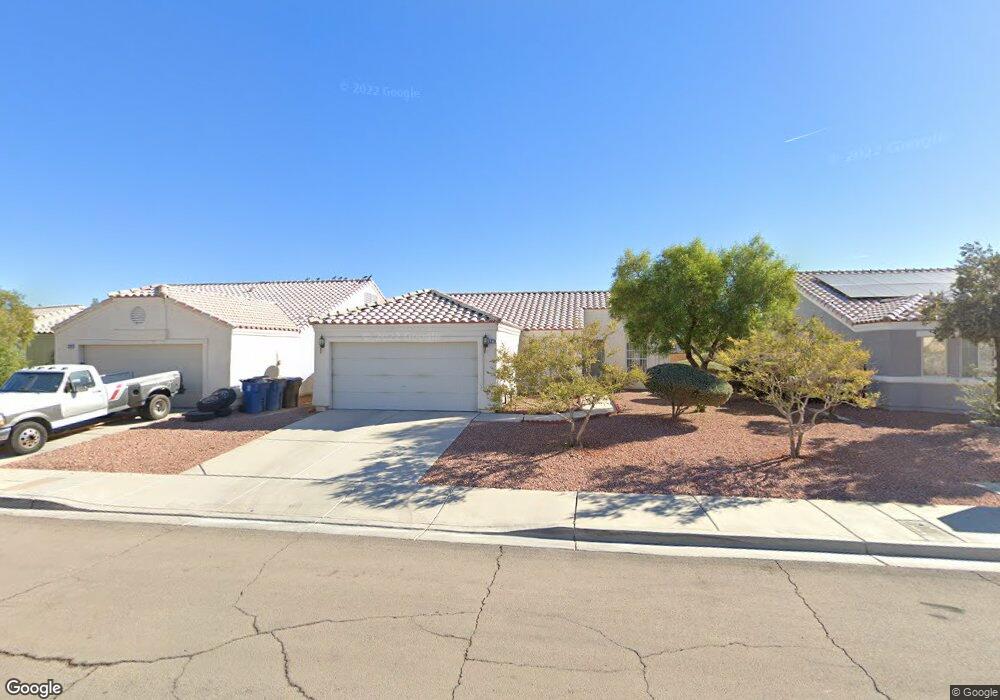
5220 Turtle Reef Way North Las Vegas, NV 89031
Craig Ranch NeighborhoodEstimated Value: $343,718 - $368,000
3
Beds
2
Baths
1,124
Sq Ft
$319/Sq Ft
Est. Value
About This Home
This home is located at 5220 Turtle Reef Way, North Las Vegas, NV 89031 and is currently estimated at $358,180, approximately $318 per square foot. 5220 Turtle Reef Way is a home located in Clark County with nearby schools including Steve and Linda Cozine Elementary School, Brian & Teri Cram Middle School, and Mojave High School.
Ownership History
Date
Name
Owned For
Owner Type
Purchase Details
Closed on
Mar 25, 2005
Sold by
Barrios Patricia and Lopez Patricia
Bought by
Lopez Patricia
Current Estimated Value
Home Financials for this Owner
Home Financials are based on the most recent Mortgage that was taken out on this home.
Original Mortgage
$339,000
Outstanding Balance
$172,888
Interest Rate
5.7%
Mortgage Type
New Conventional
Estimated Equity
$185,292
Purchase Details
Closed on
Feb 28, 2003
Sold by
Morales Nilda
Bought by
Barrios Patricia
Home Financials for this Owner
Home Financials are based on the most recent Mortgage that was taken out on this home.
Original Mortgage
$137,000
Interest Rate
6.99%
Purchase Details
Closed on
Jan 21, 1999
Sold by
Celebrate Homes Vi Llc
Bought by
Morales Nilda
Home Financials for this Owner
Home Financials are based on the most recent Mortgage that was taken out on this home.
Original Mortgage
$80,675
Interest Rate
6.63%
Mortgage Type
FHA
Create a Home Valuation Report for This Property
The Home Valuation Report is an in-depth analysis detailing your home's value as well as a comparison with similar homes in the area
Home Values in the Area
Average Home Value in this Area
Purchase History
| Date | Buyer | Sale Price | Title Company |
|---|---|---|---|
| Lopez Patricia | -- | -- | |
| Barrios Patricia | $137,000 | Pioneer National Title | |
| Morales Nilda | $103,500 | Nevada Title Company |
Source: Public Records
Mortgage History
| Date | Status | Borrower | Loan Amount |
|---|---|---|---|
| Open | Lopez Patricia | $339,000 | |
| Closed | Barrios Patricia | $137,000 | |
| Previous Owner | Morales Nilda | $80,675 |
Source: Public Records
Tax History Compared to Growth
Tax History
| Year | Tax Paid | Tax Assessment Tax Assessment Total Assessment is a certain percentage of the fair market value that is determined by local assessors to be the total taxable value of land and additions on the property. | Land | Improvement |
|---|---|---|---|---|
| 2025 | $1,108 | $79,107 | $29,750 | $49,357 |
| 2024 | $1,076 | $79,107 | $29,750 | $49,357 |
| 2023 | $1,076 | $75,783 | $29,050 | $46,733 |
| 2022 | $1,050 | $65,883 | $23,100 | $42,783 |
| 2021 | $1,022 | $63,867 | $23,100 | $40,767 |
| 2020 | $988 | $62,515 | $22,050 | $40,465 |
| 2019 | $959 | $59,455 | $19,600 | $39,855 |
| 2018 | $932 | $53,185 | $14,700 | $38,485 |
| 2017 | $1,643 | $51,625 | $12,600 | $39,025 |
| 2016 | $882 | $41,788 | $9,800 | $31,988 |
| 2015 | $880 | $32,436 | $7,000 | $25,436 |
| 2014 | $854 | $27,242 | $5,250 | $21,992 |
Source: Public Records
Map
Nearby Homes
- 5240 Boca Del Mar St Unit 4A
- 1916 W Hammer Ln
- 1906 Chavez Ct
- 2108 Hollow Oak Ave
- 2112 Hollow Oak Ave
- 1826 Monte Alban Dr
- 2024 Fountain Valley Way
- 1813 Arch Stone Ave
- 2402 Roaring Lion Ave
- 1908 Monte Alban Dr
- 1907 Monte Alban Dr
- 5421 Copper Sand Ct
- 1537 Ascension Cir
- 5104 Camino Del Santo Pkwy
- 4928 Corsica Island St
- 2619 Paradise Isle Ave
- 2421 Sunrise Springs Ct
- 1325 Fiesta Grande Ct
- 1640 Mesa Blanca Way
- 1920 W Camino Carlos Rey
- 5216 Turtle Reef Way
- 5224 Turtle Reef Way
- 5217 Puma Ct
- 5212 Turtle Reef Way
- 5221 Puma Ct
- 5213 Puma Ct
- 5228 Turtle Reef Way
- 1926 Ivory Tusk Cir
- 1927 Tiger Cir
- 5225 Puma Ct
- 5208 Turtle Reef Way
- 5209 Puma Ct
- 5232 Turtle Reef Way
- 1931 Tiger Cir Unit 2B
- 1930 Ivory Tusk Cir
- 5229 Puma Ct
- 5204 Turtle Reef Way
- 5204 Turtle Reef Way Unit n/a
- 1924 Tiger Cir
- 5236 Turtle Reef Way