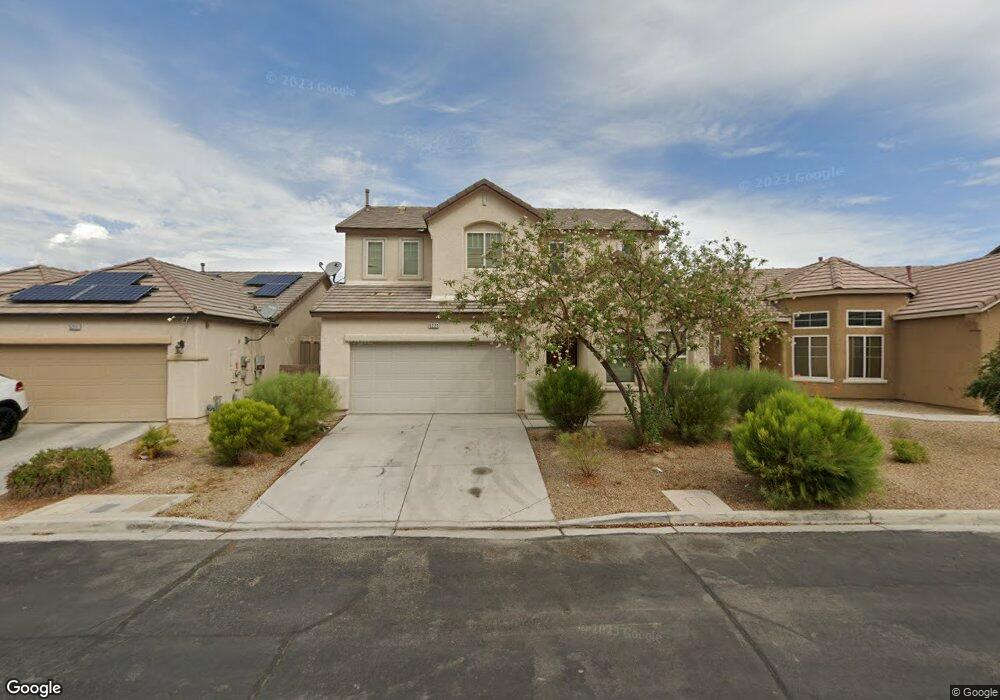
5221 Mountain Garland Ln North Las Vegas, NV 89081
Northridge NeighborhoodEstimated Value: $404,322 - $433,000
3
Beds
3
Baths
1,869
Sq Ft
$221/Sq Ft
Est. Value
About This Home
This home is located at 5221 Mountain Garland Ln, North Las Vegas, NV 89081 and is currently estimated at $413,331, approximately $221 per square foot. 5221 Mountain Garland Ln is a home located in Clark County with nearby schools including D.L. Dusty Dickens Elementary School, Clifford O. Findlay Middle School, and Mojave High School.
Ownership History
Date
Name
Owned For
Owner Type
Purchase Details
Closed on
Aug 19, 2025
Sold by
Lakeview Loan Servicing Llc
Bought by
Secretary Of Veterans Affairs
Current Estimated Value
Purchase Details
Closed on
Jul 29, 2025
Sold by
Trustee Corps and Mtc Financial Inc
Bought by
Lakeview Loan Servicing Llc
Purchase Details
Closed on
Nov 19, 2021
Sold by
Daniel Isaksen
Bought by
Lakeview Loan Servicing Llc
Purchase Details
Closed on
Nov 23, 2009
Sold by
Richmond American Homes Of Nevada Inc
Bought by
Isaksen Daniel and Isaksen Daria
Home Financials for this Owner
Home Financials are based on the most recent Mortgage that was taken out on this home.
Original Mortgage
$181,406
Interest Rate
4.88%
Mortgage Type
VA
Create a Home Valuation Report for This Property
The Home Valuation Report is an in-depth analysis detailing your home's value as well as a comparison with similar homes in the area
Home Values in the Area
Average Home Value in this Area
Purchase History
| Date | Buyer | Sale Price | Title Company |
|---|---|---|---|
| Secretary Of Veterans Affairs | -- | Servicelink Title | |
| Lakeview Loan Servicing Llc | $294,175 | Servicelink Title | |
| Lakeview Loan Servicing Llc | -- | Malcolm Cisneros | |
| Isaksen Daniel | $177,588 | Ticor Title Las Vegas |
Source: Public Records
Mortgage History
| Date | Status | Borrower | Loan Amount |
|---|---|---|---|
| Previous Owner | Isaksen Daniel | $181,406 |
Source: Public Records
Tax History Compared to Growth
Tax History
| Year | Tax Paid | Tax Assessment Tax Assessment Total Assessment is a certain percentage of the fair market value that is determined by local assessors to be the total taxable value of land and additions on the property. | Land | Improvement |
|---|---|---|---|---|
| 2025 | $2,112 | $121,675 | $34,300 | $87,375 |
| 2024 | $1,956 | $121,675 | $34,300 | $87,375 |
| 2023 | $1,956 | $115,745 | $33,600 | $82,145 |
| 2022 | $12,555 | $102,199 | $27,300 | $74,899 |
| 2021 | $1,677 | $90,540 | $23,100 | $67,440 |
| 2020 | $1,555 | $85,579 | $22,400 | $63,179 |
| 2019 | $1,457 | $81,850 | $19,950 | $61,900 |
| 2018 | $1,390 | $67,922 | $19,250 | $48,672 |
| 2017 | $2,094 | $62,412 | $12,600 | $49,812 |
| 2016 | $1,301 | $55,282 | $10,500 | $44,782 |
| 2015 | $1,297 | $50,096 | $8,050 | $42,046 |
| 2014 | $1,259 | $36,409 | $5,950 | $30,459 |
Source: Public Records
Map
Nearby Homes
- 5232 Mountain Garland Ln
- 5241 Wild Sunflower St
- 5337 Golden Melody Ln
- 3821 Van Ness Ave
- 3656 Bella Legato Ave
- 3612 Turquoise Waters Ave
- 3745 Riviera Regal Ave
- 5536 Punto Del Castello Ct
- 5625 Galivan Vista St
- 3605 Greenbriar Bluff Ave
- 3709 Corte Bella Hills Ave
- 5629 Sagamore Canyon St
- 3740 Corte Bella Hills Ave
- 3712 Corte Bella Hills Ave
- 3708 Corte Bella Hills Ave
- 5654 Sagamore Canyon St
- 3813 Jasmine Heights Ave Unit 4F
- 5650 Pleasant Palms St
- 5721 Keystone Crest St
- 4013 Villa Serena Ln
- 5217 Mountain Garland Ln
- 5225 Mountain Garland Ln
- 5213 Mountain Garland Ln
- 5229 Mountain Garland Ln
- 5224 Mountain Garland Ln
- 5220 Mountain Garland Ln
- 5216 Mountain Garland Ln
- 5228 Mountain Garland Ln
- 5212 Mountain Garland Ln Unit LOT1238
- 5212 Mountain Garland Ln
- 5208 Mountain Garland Ln
- 3732 Cicada Flower Ave
- 3740 Cicada Flower Ave
- 5236 Mountain Garland Ln
- 3728 Cicada Flower Ave
- 5237 Wild Sunflower St
- 5305 Mountain Garland Ln
- 5225 Golden Melody Ln
- 3744 Cicada Flower Ave