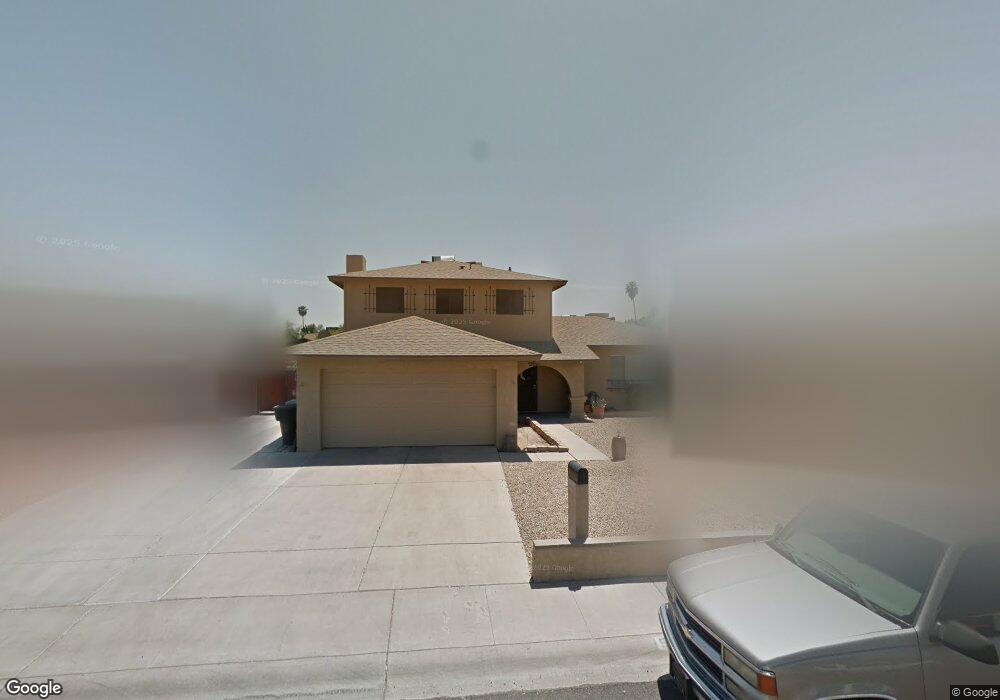
5221 W Brown St Glendale, AZ 85302
Estimated Value: $411,204 - $461,000
4
Beds
3
Baths
2,106
Sq Ft
$206/Sq Ft
Est. Value
About This Home
This home is located at 5221 W Brown St, Glendale, AZ 85302 and is currently estimated at $434,301, approximately $206 per square foot. 5221 W Brown St is a home located in Maricopa County with nearby schools including Heritage School, Ironwood High School, and Heritage Academy - Pointe.
Ownership History
Date
Name
Owned For
Owner Type
Purchase Details
Closed on
Jan 30, 2019
Sold by
Osbon Michael A and Osbon Mary R
Bought by
Compton Kyle and Jarvis Robyn
Current Estimated Value
Home Financials for this Owner
Home Financials are based on the most recent Mortgage that was taken out on this home.
Original Mortgage
$211,200
Outstanding Balance
$186,057
Interest Rate
4.6%
Mortgage Type
New Conventional
Estimated Equity
$248,244
Purchase Details
Closed on
Nov 21, 2017
Sold by
Osbon Michael
Bought by
Osbon Michael A and Osbon Mary R
Purchase Details
Closed on
Nov 17, 2017
Sold by
Osbon Barbara
Bought by
Osbon Michael
Purchase Details
Closed on
Jun 15, 2001
Sold by
Britts Karen Hale and Hale Karen W
Bought by
Osbon Michael and Osbon Barbara
Home Financials for this Owner
Home Financials are based on the most recent Mortgage that was taken out on this home.
Original Mortgage
$128,803
Interest Rate
7.14%
Mortgage Type
New Conventional
Create a Home Valuation Report for This Property
The Home Valuation Report is an in-depth analysis detailing your home's value as well as a comparison with similar homes in the area
Home Values in the Area
Average Home Value in this Area
Purchase History
| Date | Buyer | Sale Price | Title Company |
|---|---|---|---|
| Compton Kyle | $264,000 | Old Republic Title Agency | |
| Osbon Michael A | -- | None Available | |
| Osbon Michael | -- | None Available | |
| Osbon Michael | $130,000 | North American Title Agency |
Source: Public Records
Mortgage History
| Date | Status | Borrower | Loan Amount |
|---|---|---|---|
| Open | Compton Kyle | $211,200 | |
| Previous Owner | Osbon Michael | $128,803 |
Source: Public Records
Tax History Compared to Growth
Tax History
| Year | Tax Paid | Tax Assessment Tax Assessment Total Assessment is a certain percentage of the fair market value that is determined by local assessors to be the total taxable value of land and additions on the property. | Land | Improvement |
|---|---|---|---|---|
| 2025 | $1,123 | $14,731 | -- | -- |
| 2024 | $1,146 | $14,030 | -- | -- |
| 2023 | $1,146 | $29,010 | $5,800 | $23,210 |
| 2022 | $1,135 | $22,200 | $4,440 | $17,760 |
| 2021 | $1,219 | $20,300 | $4,060 | $16,240 |
| 2020 | $1,237 | $19,050 | $3,810 | $15,240 |
| 2019 | $1,202 | $17,020 | $3,400 | $13,620 |
| 2018 | $1,174 | $16,070 | $3,210 | $12,860 |
| 2017 | $1,182 | $15,570 | $3,110 | $12,460 |
| 2016 | $1,175 | $14,360 | $2,870 | $11,490 |
| 2015 | $1,102 | $13,010 | $2,600 | $10,410 |
Source: Public Records
Map
Nearby Homes
- 5210 W Ironwood Dr
- 5249 W Mountain View Rd
- 5323 W North Ln
- Faustus Plan at Marlowe
- Malta Plan at Marlowe
- Tamburlaine Plan at Marlowe
- Christopher Plan at Marlowe
- 9623 N 51st Dr
- 4932 W Cheryl Dr
- 10608 N 53rd Cir
- 4924 W Brown St
- 5407 W North Ln
- 4930 W Beryl Ave
- 5209 W Palo Verde Ave
- 5236 W Peoria Ave Unit 128
- 5236 W Peoria Ave Unit 202
- 5131 W Christy Dr
- 5112 W Carol Ave
- 9710 N 55th Ave
- 4831 W Brown St
- 5227 W Brown St
- 5215 W Brown St Unit 1
- 5220 W Onyx Ave
- 5233 W Brown St
- 5209 W Brown St
- 5208 W Onyx Ave
- 5226 W Onyx Ave
- 5226 W Onyx Ave
- 5226 W Brown St
- 5220 W Brown St
- 5232 W Cheryl Dr
- 5214 W Brown St
- 5232 W Onyx Ave
- 5202 W Onyx Ave
- 5239 W Brown St
- 5203 W Brown St
- 5208 W Cheryl Dr
- 5238 W Cheryl Dr
- 5238 W Onyx Ave
- 5136 W Onyx Ave