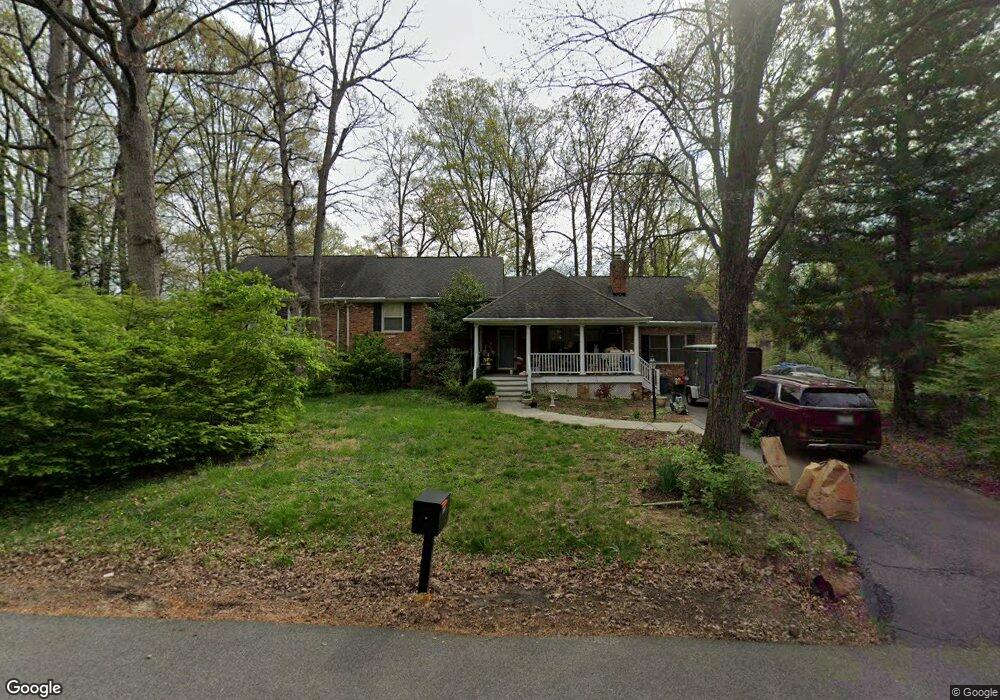
5221 Wendy Way Springfield, VA 22151
Estimated Value: $925,766 - $969,000
4
Beds
4
Baths
2,951
Sq Ft
$321/Sq Ft
Est. Value
About This Home
This home is located at 5221 Wendy Way, Springfield, VA 22151 and is currently estimated at $947,192, approximately $320 per square foot. 5221 Wendy Way is a home located in Fairfax County with nearby schools including North Springfield Elementary School, Holmes Middle School, and Annandale High School.
Ownership History
Date
Name
Owned For
Owner Type
Purchase Details
Closed on
May 31, 2005
Sold by
Piper Gary R
Bought by
Berry Robert David
Current Estimated Value
Home Financials for this Owner
Home Financials are based on the most recent Mortgage that was taken out on this home.
Original Mortgage
$429,000
Outstanding Balance
$224,972
Interest Rate
5.83%
Mortgage Type
New Conventional
Estimated Equity
$722,220
Purchase Details
Closed on
Feb 15, 2000
Sold by
Howanetz Gregory
Bought by
Piper Gary R
Home Financials for this Owner
Home Financials are based on the most recent Mortgage that was taken out on this home.
Original Mortgage
$223,200
Interest Rate
8.11%
Purchase Details
Closed on
Jan 4, 1994
Sold by
Schumacher K R
Bought by
Howanetz Gregory
Home Financials for this Owner
Home Financials are based on the most recent Mortgage that was taken out on this home.
Original Mortgage
$220,500
Interest Rate
7%
Create a Home Valuation Report for This Property
The Home Valuation Report is an in-depth analysis detailing your home's value as well as a comparison with similar homes in the area
Home Values in the Area
Average Home Value in this Area
Purchase History
| Date | Buyer | Sale Price | Title Company |
|---|---|---|---|
| Berry Robert David | $660,000 | -- | |
| Piper Gary R | $279,000 | -- | |
| Howanetz Gregory | $245,500 | -- |
Source: Public Records
Mortgage History
| Date | Status | Borrower | Loan Amount |
|---|---|---|---|
| Open | Berry Robert David | $429,000 | |
| Previous Owner | Piper Gary R | $223,200 | |
| Previous Owner | Howanetz Gregory | $220,500 |
Source: Public Records
Tax History
| Year | Tax Paid | Tax Assessment Tax Assessment Total Assessment is a certain percentage of the fair market value that is determined by local assessors to be the total taxable value of land and additions on the property. | Land | Improvement |
|---|---|---|---|---|
| 2025 | $9,490 | $849,980 | $356,000 | $493,980 |
| 2024 | $9,490 | $819,130 | $356,000 | $463,130 |
| 2023 | $9,121 | $808,250 | $346,000 | $462,250 |
| 2022 | $7,846 | $686,120 | $326,000 | $360,120 |
| 2021 | $7,389 | $629,630 | $291,000 | $338,630 |
| 2020 | $7,452 | $629,630 | $291,000 | $338,630 |
| 2019 | $7,381 | $623,630 | $285,000 | $338,630 |
| 2018 | $7,172 | $623,630 | $285,000 | $338,630 |
| 2017 | $7,240 | $623,630 | $285,000 | $338,630 |
| 2016 | $7,063 | $609,630 | $271,000 | $338,630 |
Source: Public Records
Map
Nearby Homes
- 7005 Leestone St
- 5300 Easton Dr
- 5401 Ferndale St
- 7314 Inzer St
- 7313 Byrneley Ln
- 7402 Inzer St
- 6728 Hopewell Ave
- 4765 Kandel Ct
- 7331 Calvert St
- 7233 Evanston Rd
- 5216 Clifton St
- 4700 Backlick Rd
- 7403 Carmine St
- 7212 Highland St
- 7209 Sipes Ln
- 7052 Wardell St
- 7113 Falcon St
- 6532 Spring Valley Dr
- 4917 Erie St
- 5907 Camberly Ave
- 7026 Larrlyn Dr
- 7088 Leestone St
- 7086 Leestone St
- 7101 Larrlyn Dr
- 7100 Larrlyn Dr
- 7084 Leestone St
- 7029 Larrlyn Dr
- 7089 Leestone St
- 7085 Leestone St
- 5230 Wendy Way
- 7082 Leestone St
- 7025 Larrlyn Dr
- 5288 Bradgen Ct
- 7022 Larrlyn Dr
- 7083 Leestone St
- 7080 Leestone St
- 7081 Leestone St
- 5286 Bradgen Ct
- 7078 Leestone St
- 7104 Larrlyn Dr
Your Personal Tour Guide
Ask me questions while you tour the home.