5222 Glen Nook Dr Houston, TX 77016
East Little York NeighborhoodEstimated Value: $165,000 - $184,000
4
Beds
2
Baths
1,617
Sq Ft
$109/Sq Ft
Est. Value
About This Home
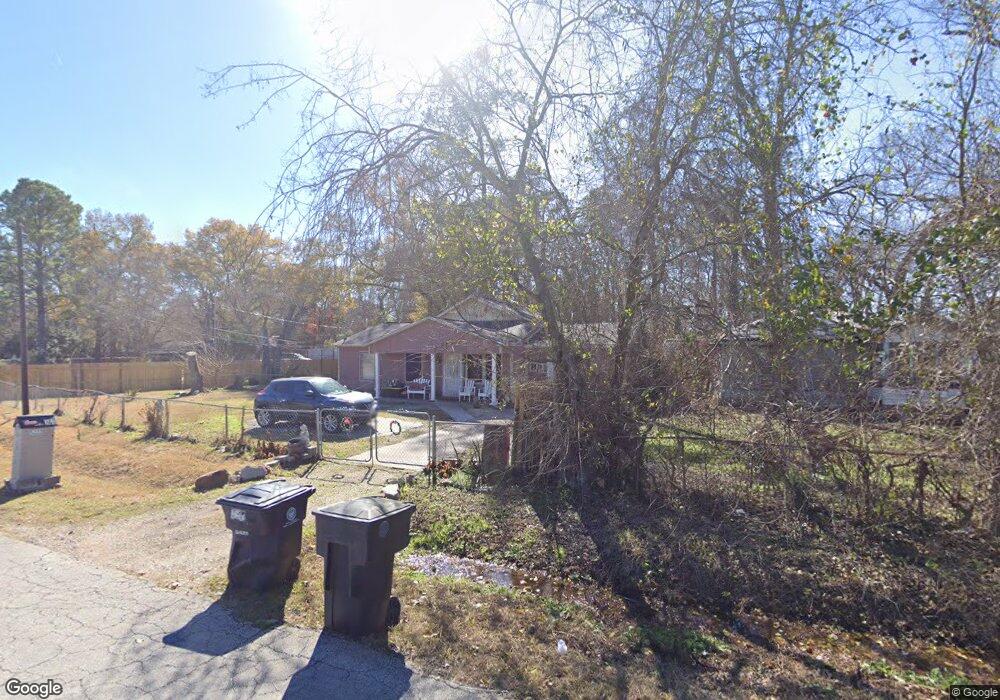
This home is located at 5222 Glen Nook Dr, Houston, TX 77016 and is currently estimated at $176,006, approximately $108 per square foot. 5222 Glen Nook Dr is a home located in Harris County with nearby schools including Shadydale Elementary School, Forest Brook Middle, and North Forest High School.
Ownership History
Date
Name
Owned For
Owner Type
Purchase Details
Closed on
Nov 1, 2004
Sold by
Nickys Land Co Lp
Bought by
Moore Glenda F and Carson Vickie G
Current Estimated Value
Home Financials for this Owner
Home Financials are based on the most recent Mortgage that was taken out on this home.
Original Mortgage
$74,699
Interest Rate
5.8%
Mortgage Type
Seller Take Back
Purchase Details
Closed on
Oct 2, 2003
Sold by
Bank One Na
Bought by
Nicky Land Co Lp
Purchase Details
Closed on
Jun 3, 2003
Sold by
Skinner William E and Grigalonis Cynthia
Bought by
Bank One Na and 1St National Bank Of Chicago
Purchase Details
Closed on
Feb 28, 1996
Sold by
Bowman Billy George
Bought by
Skinner William E and Grigalonis Cynthia
Home Financials for this Owner
Home Financials are based on the most recent Mortgage that was taken out on this home.
Original Mortgage
$32,750
Interest Rate
7.01%
Create a Home Valuation Report for This Property
The Home Valuation Report is an in-depth analysis detailing your home's value as well as a comparison with similar homes in the area
Home Values in the Area
Average Home Value in this Area
Purchase History
| Date | Buyer | Sale Price | Title Company |
|---|---|---|---|
| Moore Glenda F | -- | -- | |
| Nicky Land Co Lp | -- | First American Title | |
| Bank One Na | $32,403 | -- | |
| Skinner William E | -- | First American Title Ins Co |
Source: Public Records
Mortgage History
| Date | Status | Borrower | Loan Amount |
|---|---|---|---|
| Previous Owner | Moore Glenda F | $74,699 | |
| Previous Owner | Skinner William E | $32,750 | |
| Closed | Skinner William E | $3,500 |
Source: Public Records
Tax History Compared to Growth
Tax History
| Year | Tax Paid | Tax Assessment Tax Assessment Total Assessment is a certain percentage of the fair market value that is determined by local assessors to be the total taxable value of land and additions on the property. | Land | Improvement |
|---|---|---|---|---|
| 2025 | $928 | $139,726 | $56,668 | $83,058 |
| 2024 | $928 | $130,678 | $49,356 | $81,322 |
| 2023 | $928 | $125,510 | $31,076 | $94,434 |
| 2022 | $1,719 | $108,106 | $31,076 | $77,030 |
| 2021 | $1,654 | $94,229 | $21,936 | $72,293 |
| 2020 | $1,563 | $72,000 | $21,936 | $50,064 |
| 2019 | $1,485 | $64,246 | $15,355 | $48,891 |
| 2018 | $783 | $53,335 | $12,796 | $40,539 |
| 2017 | $1,349 | $53,335 | $12,796 | $40,539 |
| 2016 | $1,246 | $49,292 | $7,678 | $41,614 |
| 2015 | $839 | $49,292 | $7,678 | $41,614 |
| 2014 | $839 | $49,292 | $7,678 | $41,614 |
Source: Public Records
Map
Nearby Homes
- 5022 Bretshire Dr
- 5413 Glen Nook Dr
- 5130 Farb Dr
- 5123 Francine Ln
- 4809 Edgewater Dr
- 0 Haywood St Unit 63273227
- 5621 Haywood St
- 5418 Parker Rd
- 7902 S Lockwood Dr
- 4509 Haywood St
- 7631 Hirsch Rd
- 5203 Mayle St
- 5125 Mayle St
- 5618 Briarwick Ln
- 5914 Breland St
- 10606 Bucknell Rd
- 6001 Bretshire Dr
- 10627 Castleton St
- 10434 Envoy St
- 10221 Bretton Dr
- 5221 Glen Nook Dr
- 5214 Glen Nook Dr
- 10434 Belridge St
- 10452 Hirsch Rd
- 5309 Glen Nook Dr
- 0 Glen Nook Dr
- 5313 Glen Nook Dr
- 10425 Peachtree St
- 10421 Belridge St
- 5317 Glen Nook Dr
- 10422 Belridge St
- 5321 Glen Nook Dr
- 5121.5 Peachtree St
- 10414 Belridge St
- 5405 Glen Nook Dr
- 10413 Belridge St
- 5409 Glen Nook Dr
- 4811 Terrell St
- 10409 Peachtree St
- 5402 Glen Nook Dr