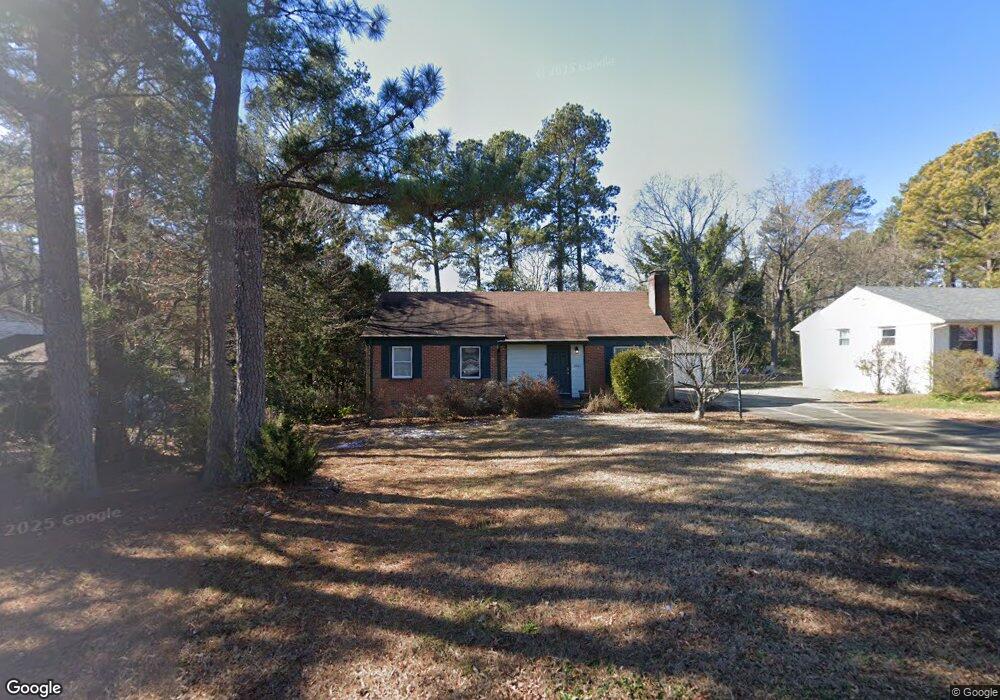
5222 Revere Rd Durham, NC 27713
Estimated Value: $308,000 - $339,000
3
Beds
2
Baths
1,107
Sq Ft
$293/Sq Ft
Est. Value
About This Home
This home is located at 5222 Revere Rd, Durham, NC 27713 and is currently estimated at $323,877, approximately $292 per square foot. 5222 Revere Rd is a home located in Durham County with nearby schools including Parkwood Elementary, Lowe's Grove Middle, and Hillside High School.
Ownership History
Date
Name
Owned For
Owner Type
Purchase Details
Closed on
Sep 30, 2015
Sold by
Kinghorn Marsha P and Kinghorn James B
Bought by
Lundin Matthew Russell
Current Estimated Value
Home Financials for this Owner
Home Financials are based on the most recent Mortgage that was taken out on this home.
Original Mortgage
$148,900
Outstanding Balance
$117,510
Interest Rate
3.97%
Mortgage Type
New Conventional
Estimated Equity
$206,367
Purchase Details
Closed on
Apr 25, 2008
Sold by
Hanson Kacey A
Bought by
Kinghorn Marsha P
Purchase Details
Closed on
Sep 17, 2004
Sold by
Banka Marc and Banka Caroline Warren
Bought by
Hanson Kacey A
Home Financials for this Owner
Home Financials are based on the most recent Mortgage that was taken out on this home.
Original Mortgage
$118,850
Interest Rate
5.92%
Mortgage Type
Purchase Money Mortgage
Purchase Details
Closed on
Jun 13, 2003
Sold by
Hartman Sharon Denise and Banka Sharon Denise
Bought by
Banka Marc
Create a Home Valuation Report for This Property
The Home Valuation Report is an in-depth analysis detailing your home's value as well as a comparison with similar homes in the area
Home Values in the Area
Average Home Value in this Area
Purchase History
| Date | Buyer | Sale Price | Title Company |
|---|---|---|---|
| Lundin Matthew Russell | $149,000 | Attorney | |
| Kinghorn Marsha P | $135,000 | None Available | |
| Hanson Kacey A | $123,500 | -- | |
| Banka Marc | -- | -- |
Source: Public Records
Mortgage History
| Date | Status | Borrower | Loan Amount |
|---|---|---|---|
| Open | Lundin Matthew Russell | $148,900 | |
| Previous Owner | Hanson Kacey A | $118,850 |
Source: Public Records
Tax History Compared to Growth
Tax History
| Year | Tax Paid | Tax Assessment Tax Assessment Total Assessment is a certain percentage of the fair market value that is determined by local assessors to be the total taxable value of land and additions on the property. | Land | Improvement |
|---|---|---|---|---|
| 2025 | $3,013 | $303,937 | $128,000 | $175,937 |
| 2024 | $2,405 | $172,406 | $38,430 | $133,976 |
| 2023 | $2,258 | $172,406 | $38,430 | $133,976 |
| 2022 | $2,207 | $172,406 | $38,430 | $133,976 |
| 2021 | $2,196 | $172,406 | $38,430 | $133,976 |
| 2020 | $2,145 | $172,406 | $38,430 | $133,976 |
| 2019 | $2,145 | $172,406 | $38,430 | $133,976 |
| 2018 | $1,911 | $140,874 | $28,822 | $112,052 |
| 2017 | $1,897 | $140,874 | $28,822 | $112,052 |
| 2016 | $1,833 | $140,874 | $28,822 | $112,052 |
| 2015 | $1,602 | $115,703 | $25,051 | $90,652 |
| 2014 | $1,602 | $115,703 | $25,051 | $90,652 |
Source: Public Records
Map
Nearby Homes
- 1621 Clermont Rd
- 5320 Newhall Rd
- 1304 Seaton Rd Unit 1
- 1304 Seaton Rd Unit 24
- 1445 Sedwick Rd
- 104 Deblyn Ct
- 1227 Seaton Rd Unit 54
- 1728 Euclid Rd
- 1109 Seaton Rd
- 5504 Pelham Rd
- 6353 Grandale Dr
- 5817 Newhall Rd
- 115 Lattimore Ln
- 1317 Elmset Ln
- 1021 Park Glen Place
- 5 Huckleberry Ct
- 5100 Mccormick Rd
- 2 Donnelly Ct
- 6010 Newhall Rd
- 1510 Haventree Rd