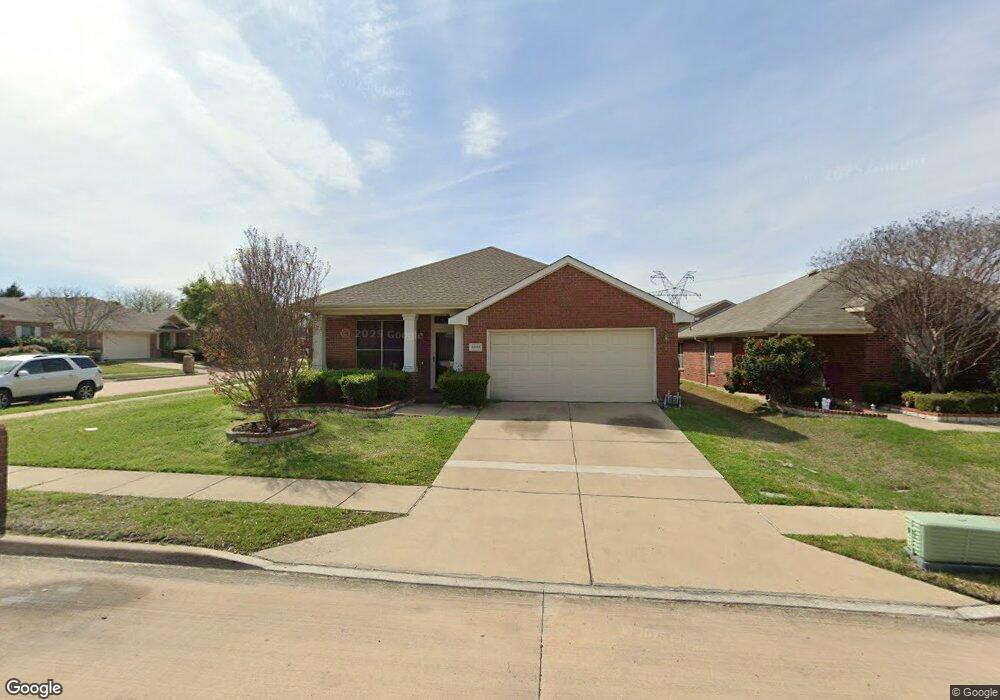
5223 Smithfield Ct Sachse, TX 75048
Estimated Value: $370,287 - $425,000
4
Beds
2
Baths
2,030
Sq Ft
$195/Sq Ft
Est. Value
About This Home
This home is located at 5223 Smithfield Ct, Sachse, TX 75048 and is currently estimated at $395,072, approximately $194 per square foot. 5223 Smithfield Ct is a home located in Dallas County with nearby schools including Harmony Science Academy - Garland, Pinnacle Montessori of Sachse, and Firewheel Christian Academy.
Ownership History
Date
Name
Owned For
Owner Type
Purchase Details
Closed on
Jun 30, 2010
Sold by
Wiggins Victorie and Wiggins Victoria
Bought by
Delelegn Michael A
Current Estimated Value
Home Financials for this Owner
Home Financials are based on the most recent Mortgage that was taken out on this home.
Original Mortgage
$162,807
Outstanding Balance
$108,350
Interest Rate
4.75%
Mortgage Type
FHA
Estimated Equity
$286,722
Purchase Details
Closed on
Sep 10, 2004
Sold by
White Jacob and White Dianna
Bought by
Munguia Leonel Lee
Home Financials for this Owner
Home Financials are based on the most recent Mortgage that was taken out on this home.
Original Mortgage
$82,500
Interest Rate
5.95%
Mortgage Type
Stand Alone First
Purchase Details
Closed on
Nov 21, 2003
Sold by
Weekley Homes Lp
Bought by
White Jacob and White Dianna
Home Financials for this Owner
Home Financials are based on the most recent Mortgage that was taken out on this home.
Original Mortgage
$140,788
Interest Rate
5.93%
Mortgage Type
VA
Create a Home Valuation Report for This Property
The Home Valuation Report is an in-depth analysis detailing your home's value as well as a comparison with similar homes in the area
Home Values in the Area
Average Home Value in this Area
Purchase History
| Date | Buyer | Sale Price | Title Company |
|---|---|---|---|
| Delelegn Michael A | -- | Fnt | |
| Munguia Leonel Lee | -- | Rt | |
| White Jacob | -- | -- |
Source: Public Records
Mortgage History
| Date | Status | Borrower | Loan Amount |
|---|---|---|---|
| Open | Delelegn Michael A | $162,807 | |
| Previous Owner | Munguia Leonel Lee | $82,500 | |
| Previous Owner | White Jacob | $140,788 |
Source: Public Records
Tax History Compared to Growth
Tax History
| Year | Tax Paid | Tax Assessment Tax Assessment Total Assessment is a certain percentage of the fair market value that is determined by local assessors to be the total taxable value of land and additions on the property. | Land | Improvement |
|---|---|---|---|---|
| 2025 | $5,764 | $370,020 | $80,000 | $290,020 |
| 2024 | $5,764 | $370,020 | $80,000 | $290,020 |
| 2023 | $5,764 | $370,020 | $80,000 | $290,020 |
| 2022 | $7,299 | $305,090 | $50,000 | $255,090 |
| 2021 | $6,193 | $240,630 | $36,000 | $204,630 |
| 2020 | $6,295 | $240,630 | $36,000 | $204,630 |
| 2019 | $6,269 | $221,010 | $36,000 | $185,010 |
| 2018 | $6,330 | $221,010 | $36,000 | $185,010 |
| 2017 | $5,542 | $192,980 | $36,000 | $156,980 |
| 2016 | $4,925 | $192,980 | $36,000 | $156,980 |
| 2015 | $3,998 | $178,960 | $36,000 | $142,960 |
| 2014 | $3,998 | $163,820 | $36,000 | $127,820 |
Source: Public Records
Map
Nearby Homes
- 5115 Willow Bend Ln
- 4404 Coldbrook Ln
- 4819 Jackson Meadows Dr
- 4505 Merritt Rd
- 5111 Live Oak Dr
- 5159 Willow Bend Ln
- 4812 Riverbirch Dr
- 4133 Lone Elm St
- 5207 Seth Ave
- 4609 Hunters Ridge Dr
- 3731 Frost St
- 3821 Red Oak St
- 4807 Sachse Rd
- 3820 Blossom Dr
- 3610 Pacific Way
- 3602 Pacific Way
- 5426 Depot Dr
- 5306 Waterloo Dr
- 3505 Central Blvd
- 3403 Scotsman Rd
- 5305 Smithfield Ct
- 5121 Smithfield Ct
- 5309 Smithfield Ct
- 5204 Smithfield Ct
- 5122 Smithfield Ct
- 5208 Smithfield Ct
- 5313 Smithfield Ct
- 5302 Smithfield Ct
- 5116 Willow Bend Ln
- 5118 Smithfield Ct
- 5220 Smithfield Ct
- 5306 Smithfield Ct
- 5212 Smithfield Ct
- 5120 Willow Bend Ln
- 5317 Smithfield Ct
- 5310 Smithfield Ct
- 5216 Smithfield Ct
- 5114 Smithfield Ct
- 5109 Smithfield Ct
- 5314 Smithfield Ct