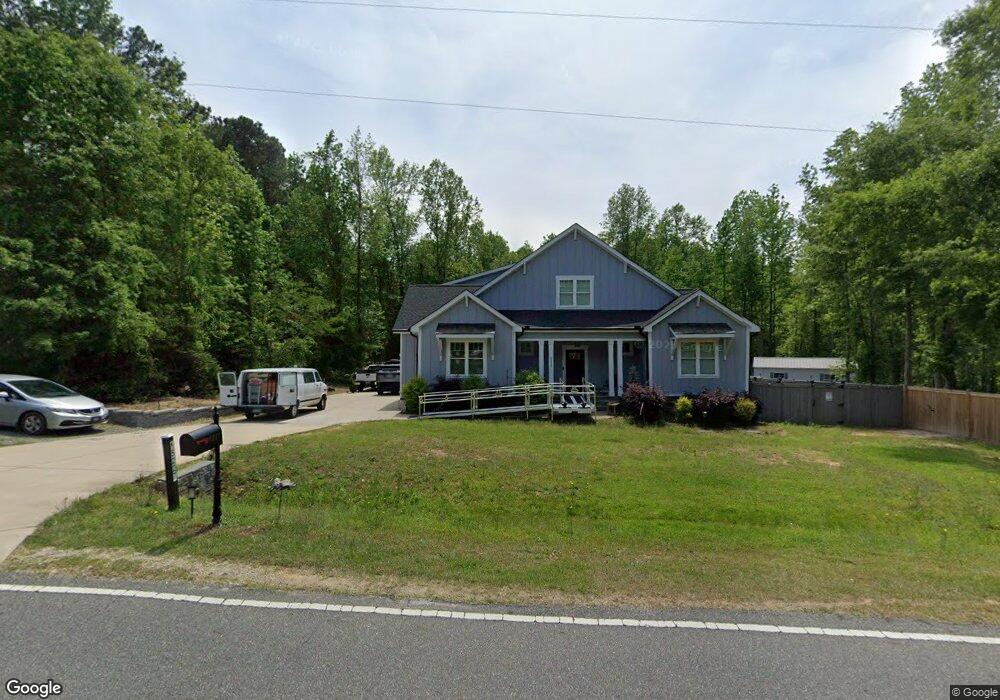
5223 Spence Farm Rd Holly Springs, NC 27540
Estimated Value: $251,000 - $391,493
--
Bed
2
Baths
1,676
Sq Ft
$194/Sq Ft
Est. Value
About This Home
This home is located at 5223 Spence Farm Rd, Holly Springs, NC 27540 and is currently estimated at $324,623, approximately $193 per square foot. 5223 Spence Farm Rd is a home located in Wake County with nearby schools including Fuquay-Varina High and Southern Wake Academy.
Ownership History
Date
Name
Owned For
Owner Type
Purchase Details
Closed on
Nov 18, 2021
Sold by
Nguyen Tien and Nguyen Thanh Xuan
Bought by
Zelada Roberto O
Current Estimated Value
Home Financials for this Owner
Home Financials are based on the most recent Mortgage that was taken out on this home.
Original Mortgage
$225,000
Outstanding Balance
$206,174
Interest Rate
2.99%
Mortgage Type
Seller Take Back
Estimated Equity
$118,449
Purchase Details
Closed on
Sep 28, 2021
Sold by
Winston Jennifer B
Bought by
Nguyen Tien
Home Financials for this Owner
Home Financials are based on the most recent Mortgage that was taken out on this home.
Original Mortgage
$225,000
Outstanding Balance
$206,174
Interest Rate
2.99%
Mortgage Type
Seller Take Back
Estimated Equity
$118,449
Purchase Details
Closed on
Dec 1, 1980
Bought by
Winston Mack and Winston Jennifer B
Create a Home Valuation Report for This Property
The Home Valuation Report is an in-depth analysis detailing your home's value as well as a comparison with similar homes in the area
Home Values in the Area
Average Home Value in this Area
Purchase History
| Date | Buyer | Sale Price | Title Company |
|---|---|---|---|
| Zelada Roberto O | $250,000 | -- | |
| Nguyen Tien | $160,000 | None Available | |
| Winston Mack | $7,000 | -- |
Source: Public Records
Mortgage History
| Date | Status | Borrower | Loan Amount |
|---|---|---|---|
| Open | Zelada Roberto O | $225,000 | |
| Closed | Zelada Roberto O | $225,000 |
Source: Public Records
Tax History Compared to Growth
Tax History
| Year | Tax Paid | Tax Assessment Tax Assessment Total Assessment is a certain percentage of the fair market value that is determined by local assessors to be the total taxable value of land and additions on the property. | Land | Improvement |
|---|---|---|---|---|
| 2025 | $1,626 | $251,048 | $152,350 | $98,698 |
| 2024 | $1,579 | $251,048 | $152,350 | $98,698 |
| 2023 | $1,202 | $151,646 | $57,400 | $94,246 |
| 2022 | $1,115 | $151,646 | $57,400 | $94,246 |
| 2021 | $1,086 | $151,646 | $57,400 | $94,246 |
| 2020 | $1,068 | $151,646 | $57,400 | $94,246 |
| 2019 | $1,109 | $133,378 | $61,770 | $71,608 |
| 2018 | $1,021 | $133,378 | $61,770 | $71,608 |
| 2017 | $968 | $133,378 | $61,770 | $71,608 |
| 2016 | $949 | $133,378 | $61,770 | $71,608 |
| 2015 | $935 | $131,699 | $59,630 | $72,069 |
| 2014 | $887 | $131,699 | $59,630 | $72,069 |
Source: Public Records
Map
Nearby Homes
- 0 Commission Dr
- 1210 Briar Gate Dr
- 1020 Garrow Dr
- 1017 Quindell Dr
- 916 Briar Gate Dr
- 809 Briar Gate Dr
- 552 Stobhill Ln
- 412 Stobhill Ln
- 975 Wilbon
- 945 Wilbon Rd
- 909 Wilbon Rd
- 328 Edgecroft Way
- 2113 Feather Ridge Dr
- 6625 Maggiewood Ln
- 885 Wilbon Rd
- 316 Edgecroft Way
- 1421 Hopson Downs Ct
- 1728 Balfour Downs Cir
- 713 Laurel Spring Dr
- 1504 Maelyn Way
- 5129 Little Beaverdam Ct
- 5225 Spence Farm Rd
- 5225 Spence Farm Rd Unit LOT 1
- 5225 Spence Farm Rd
- 5225 Spence Farm Rd Unit LOT
- 5227 Spence Farm Rd
- 5221 Spence Farm Rd
- 5217 Spence Farm Rd
- 5125 Little Beaverdam Ct
- 5128 Little Beaverdam Ct
- 5121 Little Beaverdam Ct
- 5209 Spence Farm Rd
- 5124 Little Beaverdam Ct
- 5120 Little Beaverdam Ct
- 5204 Old Powell Rd
- 5117 Little Beaverdam Ct
- 5212 Old Powell Rd
- 5112 Little Beaverdam Ct
- 5216 Old Powell Rd
- 5208 Old Powell Rd