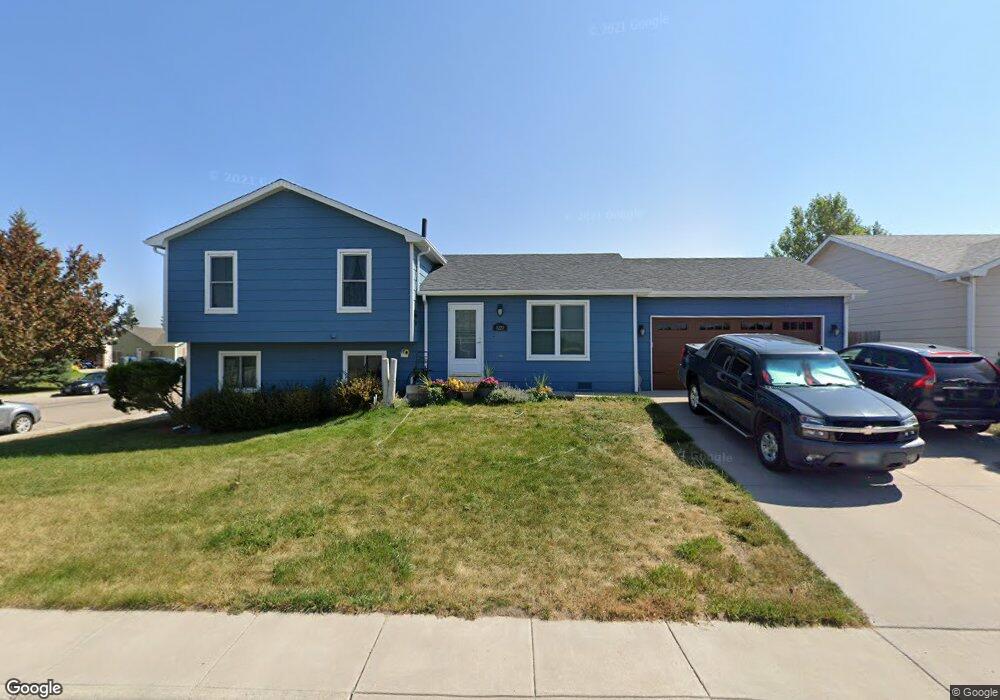
5223 View Point Ct Cheyenne, WY 82009
Estimated Value: $377,952 - $444,000
--
Bed
--
Bath
1,752
Sq Ft
$229/Sq Ft
Est. Value
About This Home
This home is located at 5223 View Point Ct, Cheyenne, WY 82009 and is currently estimated at $401,488, approximately $229 per square foot. 5223 View Point Ct is a home located in Laramie County with nearby schools including Dildine Elementary School, Carey Junior High School, and East High School.
Ownership History
Date
Name
Owned For
Owner Type
Purchase Details
Closed on
Jun 15, 2007
Sold by
Bodan Reona S
Bought by
Bush James G and Bush Traci L
Current Estimated Value
Home Financials for this Owner
Home Financials are based on the most recent Mortgage that was taken out on this home.
Original Mortgage
$192,000
Outstanding Balance
$117,293
Interest Rate
6.16%
Mortgage Type
Purchase Money Mortgage
Estimated Equity
$284,195
Purchase Details
Closed on
Apr 1, 2007
Sold by
Bodan Darren E
Bought by
Bodan Reona S
Purchase Details
Closed on
Jul 28, 2000
Sold by
Simone Steven A and Simone Andrea S
Bought by
Bodan Darren E and Bodan Reona S
Home Financials for this Owner
Home Financials are based on the most recent Mortgage that was taken out on this home.
Original Mortgage
$132,050
Interest Rate
8.23%
Create a Home Valuation Report for This Property
The Home Valuation Report is an in-depth analysis detailing your home's value as well as a comparison with similar homes in the area
Home Values in the Area
Average Home Value in this Area
Purchase History
| Date | Buyer | Sale Price | Title Company |
|---|---|---|---|
| Bush James G | -- | None Available | |
| Bodan Reona S | -- | None Available | |
| Bodan Darren E | -- | -- |
Source: Public Records
Mortgage History
| Date | Status | Borrower | Loan Amount |
|---|---|---|---|
| Open | Bush James G | $192,000 | |
| Previous Owner | Bodan Darren E | $132,050 |
Source: Public Records
Tax History Compared to Growth
Tax History
| Year | Tax Paid | Tax Assessment Tax Assessment Total Assessment is a certain percentage of the fair market value that is determined by local assessors to be the total taxable value of land and additions on the property. | Land | Improvement |
|---|---|---|---|---|
| 2025 | $1,861 | $22,763 | $3,412 | $19,351 |
| 2024 | $1,861 | $29,325 | $4,549 | $24,776 |
| 2023 | $1,898 | $29,838 | $4,549 | $25,289 |
| 2022 | $1,822 | $28,248 | $4,549 | $23,699 |
| 2021 | $1,646 | $25,750 | $4,549 | $21,201 |
| 2020 | $1,491 | $23,666 | $4,549 | $19,117 |
| 2019 | $1,426 | $22,744 | $4,549 | $18,195 |
| 2018 | $1,318 | $21,423 | $3,423 | $18,000 |
| 2017 | $1,284 | $20,797 | $3,423 | $17,374 |
| 2016 | $1,241 | $20,183 | $3,237 | $16,946 |
| 2015 | $1,175 | $19,261 | $3,237 | $16,024 |
| 2014 | $1,171 | $19,111 | $3,237 | $15,874 |
Source: Public Records
Map
Nearby Homes
- 5247 Panorama Dr
- TBD Lot 44 Panorama Dr
- TBD Lot 40 Panorama Dr
- TBD Lot 39 Panorama Dr
- TBD Lot 38 Panorama Dr
- TBD Lot 36 Panorama Dr
- TBD Lot 37 Panorama Dr
- TBD Lot 35 Panorama Dr
- TBD Lot 34 Panorama Dr
- 4500 Carmel Dr
- 5106 Sullivan St
- 4904 Topaz Dr
- 4417 Everton Dr
- 4612 Shell Beach Ave
- 4807 Connie Dr
- 4104 Rogers Ave
- 5117 Lasso Dr
- 5327 Sullivan St
- 5331 Sullivan St
- 5323 Sullivan St
- 5217 View Point Ct
- 5240 Panorama Dr
- 5211 View Point Ct
- 5253 Panorama Dr
- 5259 Panorama Dr
- 5250 Panorama Dr
- 5234 Panorama Dr
- 5265 Panorama Dr
- 5216 View Point Ct
- 5207 View Point Ct
- 5316 Panorama Ct
- 5271 Panorama Dr
- 5256 Panorama Dr
- 5228 Panorama Dr
- 5277 Panorama Dr
- 5212 View Point Ct
- 5206 View Point Ct
- 5334 Panorama Ct
- 5201 View Point Ct
- 5315 Panorama Ct