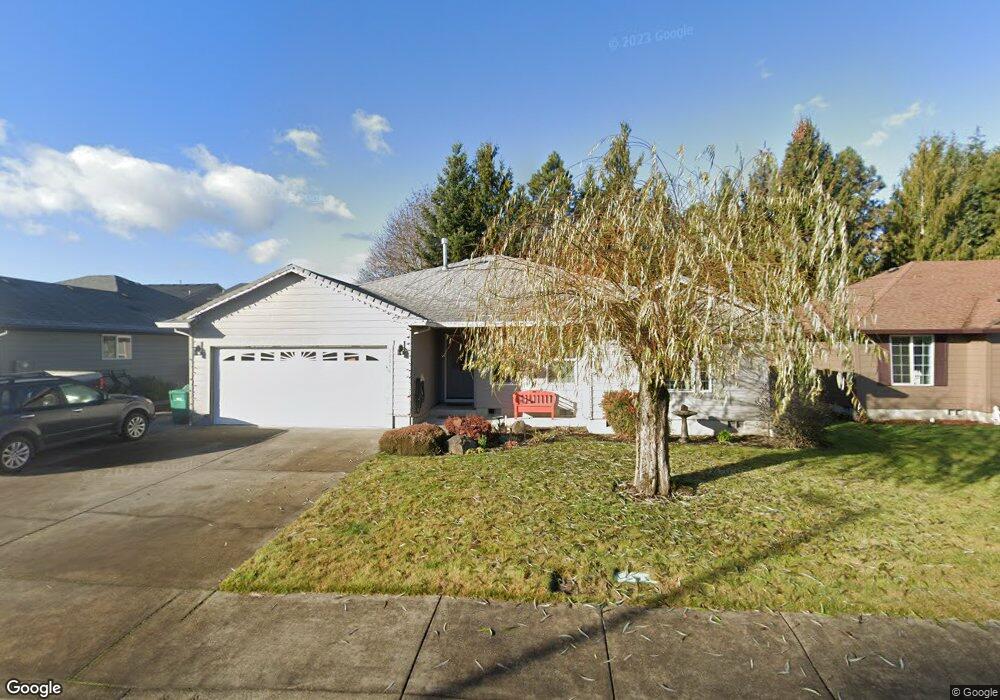
52239 SE Tyler St Scappoose, OR 97056
Estimated Value: $470,424 - $571,000
4
Beds
2
Baths
1,874
Sq Ft
$272/Sq Ft
Est. Value
About This Home
This home is located at 52239 SE Tyler St, Scappoose, OR 97056 and is currently estimated at $509,356, approximately $271 per square foot. 52239 SE Tyler St is a home located in Columbia County with nearby schools including Scappoose High School, South Columbia Family School, and Scappoose Adventist School.
Ownership History
Date
Name
Owned For
Owner Type
Purchase Details
Closed on
Jun 6, 2022
Sold by
Jones Richard T
Bought by
Gentry Jacob
Current Estimated Value
Home Financials for this Owner
Home Financials are based on the most recent Mortgage that was taken out on this home.
Original Mortgage
$280,000
Outstanding Balance
$265,217
Interest Rate
5.09%
Mortgage Type
New Conventional
Estimated Equity
$244,139
Purchase Details
Closed on
Sep 25, 2009
Sold by
Crawford David C and Crawford Judith K
Bought by
Jones Richard T and Jones Joyce F
Home Financials for this Owner
Home Financials are based on the most recent Mortgage that was taken out on this home.
Original Mortgage
$135,000
Interest Rate
5.25%
Mortgage Type
New Conventional
Purchase Details
Closed on
Jun 15, 2004
Sold by
Strobel Merril G and Strobel Rosanne
Bought by
Crawford David C and Crawford Judith K
Home Financials for this Owner
Home Financials are based on the most recent Mortgage that was taken out on this home.
Original Mortgage
$190,900
Interest Rate
6.29%
Mortgage Type
VA
Create a Home Valuation Report for This Property
The Home Valuation Report is an in-depth analysis detailing your home's value as well as a comparison with similar homes in the area
Home Values in the Area
Average Home Value in this Area
Purchase History
| Date | Buyer | Sale Price | Title Company |
|---|---|---|---|
| Gentry Jacob | $430,000 | Ticor Title | |
| Jones Richard T | $237,500 | Ticor Title | |
| Crawford David C | $190,900 | Ticor Title |
Source: Public Records
Mortgage History
| Date | Status | Borrower | Loan Amount |
|---|---|---|---|
| Open | Gentry Jacob | $280,000 | |
| Previous Owner | Jones Richard T | $135,000 | |
| Previous Owner | Crawford David C | $190,900 |
Source: Public Records
Tax History Compared to Growth
Tax History
| Year | Tax Paid | Tax Assessment Tax Assessment Total Assessment is a certain percentage of the fair market value that is determined by local assessors to be the total taxable value of land and additions on the property. | Land | Improvement |
|---|---|---|---|---|
| 2025 | $4,432 | $252,730 | $86,140 | $166,590 |
| 2024 | $4,317 | $245,370 | $83,640 | $161,730 |
| 2023 | $4,280 | $238,230 | $86,390 | $151,840 |
| 2022 | $4,115 | $231,300 | $83,880 | $147,420 |
| 2021 | $4,008 | $224,570 | $87,680 | $136,890 |
| 2020 | $3,733 | $218,030 | $91,850 | $126,180 |
| 2019 | $3,645 | $211,680 | $88,380 | $123,300 |
| 2018 | $3,593 | $205,520 | $94,060 | $111,460 |
| 2017 | $3,532 | $199,540 | $91,320 | $108,220 |
| 2016 | $3,503 | $193,730 | $88,660 | $105,070 |
| 2015 | $3,328 | $188,090 | $73,910 | $114,180 |
| 2014 | $3,241 | $182,620 | $64,580 | $118,040 |
Source: Public Records
Map
Nearby Homes
- 52269 SE Tyler St
- 52238 Teakwood Dr
- 52144 SE 8th St
- 52256 SE 6th Ct
- 52171 Casswell Dr
- 51587 SE Oak St
- 51425 SE Oak St Unit 65
- 52407 NE 14th St
- 51784 SE 9th St
- 34579 E Columbia Ave
- 51692 SE 3rd St
- 51925 Columbia River Hwy
- 52866 NE 2nd St
- 51540 SE Westlake Dr Unit 56
- 33375 SW Rokin Way
- 33363 SW Rokin Way
- 33370 SW Rokin Way
- 33374 SW Rokin Way
- 33358 SW Rokin Way
- 33344 SW Rokin Way
- 52229 SE Tyler St
- 52249 SE Tyler St
- 52219 SE Tyler St
- 52259 SE Tyler St
- 34071 SE Elm St
- 52234 SE Tyler St
- 52244 SE Tyler St
- 52224 SE Tyler St
- 52254 SE Tyler St
- 52198 SE Tussing
- 52216 SE Tussing Way
- 52216 SE Tussing Way Unit 1
- 52214 SE Tyler St
- 52264 SE Tyler St
- 52227 Teakwood Dr
- 52227 Teakwood Dr
- 52192 SE Tussing
- 52203 SE Tussing Way
- 52279 SE Tyler St
- 52186 Tussing Way