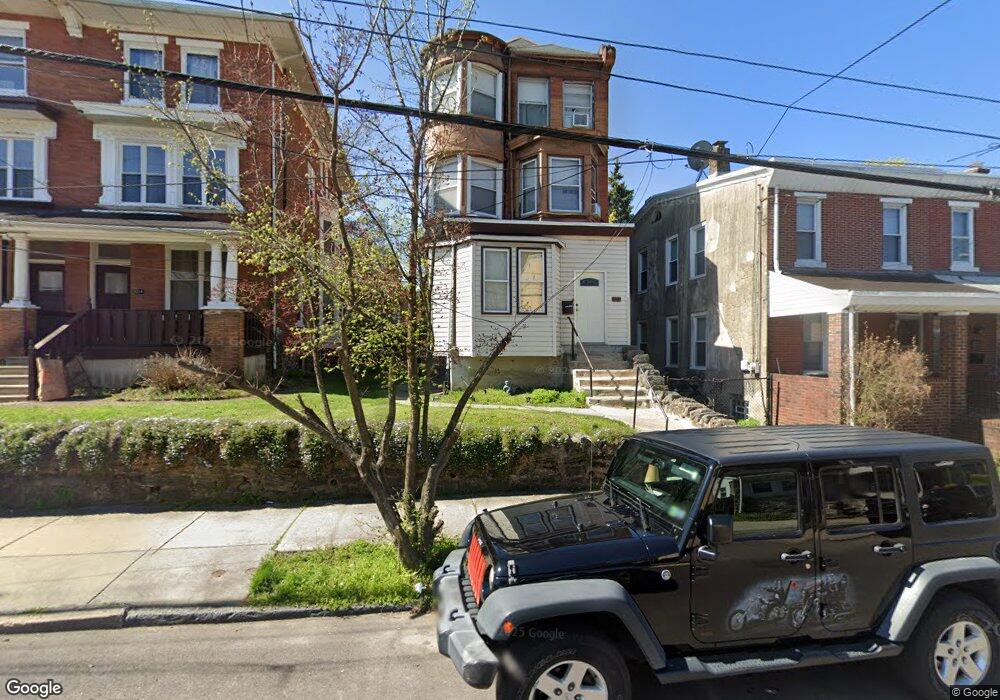
5224 Morris St Philadelphia, PA 19144
Germantown NeighborhoodEstimated Value: $210,000 - $357,000
--
Bed
--
Bath
1,306
Sq Ft
$208/Sq Ft
Est. Value
About This Home
This home is located at 5224 Morris St, Philadelphia, PA 19144 and is currently estimated at $272,286, approximately $208 per square foot. 5224 Morris St is a home located in Philadelphia County with nearby schools including John B. Kelly School, Roosevelt Theodore Middle School, and Martin Luther King High School.
Ownership History
Date
Name
Owned For
Owner Type
Purchase Details
Closed on
Dec 27, 2018
Sold by
Rgb Holdings Llc
Bought by
S Bruno Llc
Current Estimated Value
Home Financials for this Owner
Home Financials are based on the most recent Mortgage that was taken out on this home.
Original Mortgage
$95,000
Outstanding Balance
$83,702
Interest Rate
4.9%
Mortgage Type
Future Advance Clause Open End Mortgage
Estimated Equity
$188,584
Purchase Details
Closed on
Nov 20, 2018
Sold by
Stanchi Jacquelyne R
Bought by
Rgr Holdings Llc
Home Financials for this Owner
Home Financials are based on the most recent Mortgage that was taken out on this home.
Original Mortgage
$95,000
Outstanding Balance
$83,702
Interest Rate
4.9%
Mortgage Type
Future Advance Clause Open End Mortgage
Estimated Equity
$188,584
Purchase Details
Closed on
Dec 5, 1962
Bought by
Richmond James F and Richmond Helen G
Create a Home Valuation Report for This Property
The Home Valuation Report is an in-depth analysis detailing your home's value as well as a comparison with similar homes in the area
Home Values in the Area
Average Home Value in this Area
Purchase History
| Date | Buyer | Sale Price | Title Company |
|---|---|---|---|
| S Bruno Llc | $57,500 | Springfield Abstract Inc | |
| Rgr Holdings Llc | $36,500 | None Available | |
| Richmond James F | -- | -- |
Source: Public Records
Mortgage History
| Date | Status | Borrower | Loan Amount |
|---|---|---|---|
| Open | S Bruno Llc | $95,000 |
Source: Public Records
Tax History Compared to Growth
Tax History
| Year | Tax Paid | Tax Assessment Tax Assessment Total Assessment is a certain percentage of the fair market value that is determined by local assessors to be the total taxable value of land and additions on the property. | Land | Improvement |
|---|---|---|---|---|
| 2026 | $2,545 | $239,400 | $47,880 | $191,520 |
| 2025 | $2,545 | $239,400 | $47,880 | $191,520 |
| 2024 | $2,545 | $239,400 | $47,880 | $191,520 |
| 2023 | $2,545 | $181,800 | $36,360 | $145,440 |
| 2022 | $1,720 | $181,800 | $36,360 | $145,440 |
| 2021 | $1,720 | $0 | $0 | $0 |
| 2020 | $1,720 | $0 | $0 | $0 |
| 2019 | $1,796 | $0 | $0 | $0 |
| 2018 | $1,614 | $0 | $0 | $0 |
| 2017 | $1,614 | $0 | $0 | $0 |
| 2016 | $624 | $0 | $0 | $0 |
| 2015 | -- | $0 | $0 | $0 |
| 2014 | -- | $115,300 | $21,892 | $93,408 |
| 2012 | -- | $10,592 | $1,880 | $8,712 |
Source: Public Records
Map
Nearby Homes
- 5225 Mckean Ave
- 5238 Morris St
- 332 W Queen Ln
- 434 W Penn St
- 494 W King St
- 508 W King St
- 417 W Penn St
- 337 W Penn St
- 5347 Priscilla St
- 5349 Priscilla St
- 508 W Midvale Ave
- 510 W Midvale Ave
- 260 W Queen Ln
- 538 W Queen Ln
- 316 W Earlham Terrace
- 300 W Coulter St
- 310 W Earlham Terrace
- 302 W Earlham Terrace
- 5347 Newhall St
- 324 W Winona St
- 5226 Morris St
- 5216 Morris St
- 5228 Morris St
- 5214 Morris St
- 5230 Morris St
- 5230-32 Morris St
- 5212 Morris St
- 5232 Morris St Unit 2
- 5232 Morris St
- 5210 Morris St
- 5221 Mckean Ave
- 5217 Mckean Ave
- 5223 Mckean Ave
- 5215 Mckean Ave
- 5234 Morris St
- 5208 Morris St
- 5213 Mckean Ave
- 5227 Mckean Ave Unit 3
- 5227 Mckean Ave
- 5227 Mckean Ave