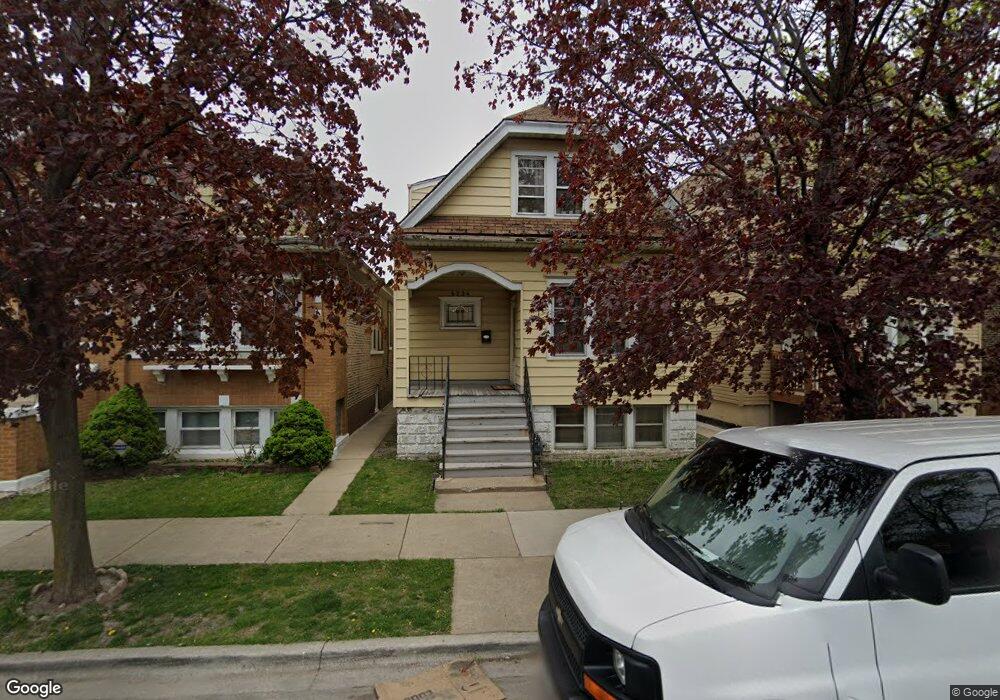
5224 W 31st St Cicero, IL 60804
Estimated Value: $284,829 - $363,000
3
Beds
3
Baths
1,767
Sq Ft
$185/Sq Ft
Est. Value
About This Home
This home is located at 5224 W 31st St, Cicero, IL 60804 and is currently estimated at $326,207, approximately $184 per square foot. 5224 W 31st St is a home located in Cook County with nearby schools including Columbus West Elementary School, Columbus East Elementary School, and Unity Jr High School.
Ownership History
Date
Name
Owned For
Owner Type
Purchase Details
Closed on
Nov 22, 2005
Sold by
Gallardo Fernando and Hernandez Marilou
Bought by
Larios Jose Herrera and Sotelo Maria D
Current Estimated Value
Home Financials for this Owner
Home Financials are based on the most recent Mortgage that was taken out on this home.
Original Mortgage
$204,000
Interest Rate
6.99%
Mortgage Type
Fannie Mae Freddie Mac
Purchase Details
Closed on
Dec 20, 2002
Sold by
Perinat Slobodanka
Bought by
Gallardo Fernando and Hernandez Marilou
Home Financials for this Owner
Home Financials are based on the most recent Mortgage that was taken out on this home.
Original Mortgage
$141,100
Interest Rate
6.13%
Mortgage Type
FHA
Purchase Details
Closed on
Apr 30, 2001
Sold by
Lasalle Bank National Assn
Bought by
Phyllis M Giles Trust
Create a Home Valuation Report for This Property
The Home Valuation Report is an in-depth analysis detailing your home's value as well as a comparison with similar homes in the area
Home Values in the Area
Average Home Value in this Area
Purchase History
| Date | Buyer | Sale Price | Title Company |
|---|---|---|---|
| Larios Jose Herrera | $255,000 | Stewart Title Of Illinois | |
| Gallardo Fernando | $177,000 | Stewart Title | |
| Phyllis M Giles Trust | -- | -- |
Source: Public Records
Mortgage History
| Date | Status | Borrower | Loan Amount |
|---|---|---|---|
| Previous Owner | Larios Jose Herrera | $204,000 | |
| Previous Owner | Gallardo Fernando | $141,100 |
Source: Public Records
Tax History Compared to Growth
Tax History
| Year | Tax Paid | Tax Assessment Tax Assessment Total Assessment is a certain percentage of the fair market value that is determined by local assessors to be the total taxable value of land and additions on the property. | Land | Improvement |
|---|---|---|---|---|
| 2024 | $5,983 | $21,000 | $4,031 | $16,969 |
| 2023 | $5,762 | $21,000 | $4,031 | $16,969 |
| 2022 | $5,762 | $16,615 | $3,469 | $13,146 |
| 2021 | $5,734 | $16,614 | $3,468 | $13,146 |
| 2020 | $5,671 | $16,614 | $3,468 | $13,146 |
| 2019 | $5,235 | $14,001 | $3,187 | $10,814 |
| 2018 | $5,094 | $14,001 | $3,187 | $10,814 |
| 2017 | $4,938 | $14,001 | $3,187 | $10,814 |
| 2016 | $4,162 | $11,052 | $2,625 | $8,427 |
| 2015 | $4,053 | $11,052 | $2,625 | $8,427 |
| 2014 | $3,926 | $11,052 | $2,625 | $8,427 |
| 2013 | $4,391 | $13,135 | $2,625 | $10,510 |
Source: Public Records
Map
Nearby Homes
- 3119 S 53rd Ave
- 3117 S 53rd Ave
- 5123 W 31st St
- 3117 S Laramie Ave Unit 3N
- 3108 S 53rd Ave
- 5241 W 30th St
- 5129 W 31st Place
- 5126 W 32nd St
- 5124 W 32nd St
- 5108 W 32nd St
- 3131 S 54th Ave
- 5059 W 29th Place
- 5028 W 31st Place
- 5101 W 32nd Place
- 3141 S 54th Ct
- 5057 W 32nd Place
- 3215 S 54th Ct
- 5017 W 32nd St
- 5011 W Ogden Ave
- 2304 S Laramie Ave
- 5230 W 31st St
- 5232 W 31st St
- 5218 W 31st St
- 5234 W 31st St
- 5216 W 31st St
- 5225 W 30th Place
- 3100 S 52nd Ct
- 5227 W 30th Place
- 5223 W 30th Place
- 5214 W 31st St
- 5229 W 30th Place
- 5219 W 30th Place
- 5231 W 30th Place
- 3102 S 52nd Ct
- 5221 30th Place
- 5240 W 31st St
- 5217 W 30th Place
- 5233 W 30th Place
- 5212 W 31st St
- 3101 S 52nd Ct