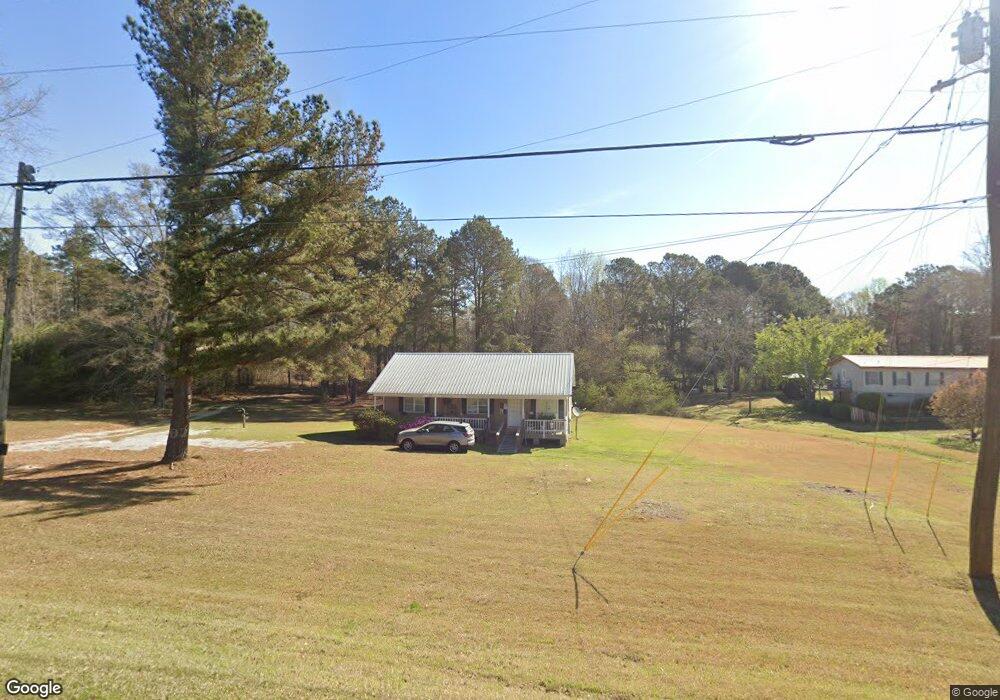
5225 Glenn Rd Unit 7 Franklin, GA 30217
Estimated Value: $190,000 - $295,000
3
Beds
2
Baths
1,144
Sq Ft
$205/Sq Ft
Est. Value
About This Home
This home is located at 5225 Glenn Rd Unit 7, Franklin, GA 30217 and is currently estimated at $233,987, approximately $204 per square foot. 5225 Glenn Rd Unit 7 is a home located in Heard County with nearby schools including Heard County High School.
Ownership History
Date
Name
Owned For
Owner Type
Purchase Details
Closed on
Oct 16, 2019
Sold by
Burkey Glenn
Bought by
Cannon Ronald W and Cannon Shirley A
Current Estimated Value
Home Financials for this Owner
Home Financials are based on the most recent Mortgage that was taken out on this home.
Original Mortgage
$122,400
Outstanding Balance
$108,548
Interest Rate
4.12%
Mortgage Type
New Conventional
Estimated Equity
$125,439
Purchase Details
Closed on
Jun 3, 2009
Sold by
Nationstar Mortgage Llc
Bought by
Burkey Glenn and Burkey Pamela
Purchase Details
Closed on
Jul 3, 2007
Sold by
Wulff Mary
Bought by
Nationstar Mtg Llc
Purchase Details
Closed on
Sep 10, 2002
Sold by
Battles Mary Roxanne
Bought by
Wulff Mary
Purchase Details
Closed on
Oct 23, 1996
Sold by
Gay Mary Roxanne
Bought by
Battles Mary Roxanne
Purchase Details
Closed on
Feb 7, 1994
Sold by
Gay Mary Roxanne
Bought by
Gay Mary Roxanne
Purchase Details
Closed on
Nov 8, 1993
Bought by
Gay Mary Roxanne
Create a Home Valuation Report for This Property
The Home Valuation Report is an in-depth analysis detailing your home's value as well as a comparison with similar homes in the area
Home Values in the Area
Average Home Value in this Area
Purchase History
| Date | Buyer | Sale Price | Title Company |
|---|---|---|---|
| Cannon Ronald W | $122,400 | -- | |
| Burkey Glenn | $15,000 | -- | |
| Nationstar Mtg Llc | $76,288 | -- | |
| Wulff Mary | -- | -- | |
| Battles Mary Roxanne | -- | -- | |
| Gay Mary Roxanne | -- | -- | |
| Gay Mary Roxanne | -- | -- |
Source: Public Records
Mortgage History
| Date | Status | Borrower | Loan Amount |
|---|---|---|---|
| Open | Cannon Ronald W | $122,400 |
Source: Public Records
Tax History Compared to Growth
Tax History
| Year | Tax Paid | Tax Assessment Tax Assessment Total Assessment is a certain percentage of the fair market value that is determined by local assessors to be the total taxable value of land and additions on the property. | Land | Improvement |
|---|---|---|---|---|
| 2024 | $1,246 | $61,789 | $3,288 | $58,501 |
| 2023 | $1,170 | $56,074 | $2,740 | $53,334 |
| 2022 | $1,117 | $53,528 | $1,700 | $51,828 |
| 2021 | $924 | $42,072 | $1,700 | $40,372 |
| 2020 | $860 | $38,737 | $1,700 | $37,037 |
| 2019 | $697 | $38,737 | $1,700 | $37,037 |
| 2018 | $711 | $31,408 | $1,700 | $29,708 |
| 2017 | $669 | $29,632 | $1,506 | $28,126 |
| 2016 | $562 | $24,892 | $1,506 | $23,386 |
| 2015 | -- | $23,086 | $2,800 | $20,286 |
| 2014 | -- | $23,086 | $2,800 | $20,286 |
| 2013 | -- | $26,872 | $2,800 | $24,072 |
Source: Public Records
Map
Nearby Homes
- 4377 Rock Mills Rd
- 3414 Rock Mills Rd
- TRACT 3 Sheppard Rd
- 250 Glenn Mill Farms
- 1440 Butler Rd
- 57+/- AC Victory Rd
- 0 County Road 684 Unit 21414226
- 0 Tower Rd
- 57+/- Ac Victory Rd
- 153 N Whatley Rd
- 0 Tbd Tower Rd
- 14.8 + - Ac Bethel Rd W
- 18+/- Ac Bethel Rd W
- 2758 Straylott Rd
- 14.8 +/- AC Bethel Rd W
- 18 +/- AC Bethel Rd W
- 0 County Road 655 Unit 25188732
- 0 County Road 655
- 0 County Road 655 Unit 177093
- 1480 Liberty Hill Rd
- 5225 Glenn Rd
- 5269 Glenn Rd
- 5271 Glenn Rd
- 5149 Glenn Rd
- 5268 Glenn Rd
- 4546 Glenn Rd
- 5217 Glenn Rd
- 5358 Glenn Rd
- 4496 Liberty Hill Glenn Rd
- 5410 Glenn Rd
- 4491 Liberty Hill Glenn Rd
- 4569 Liberty Hill Glenn Rd
- 4794 Glenn Rd
- 4266 Liberty Hill Glenn Rd
- 5457 Glenn Rd
- 5493 Glenn Rd
- 3950 Rockmills Rd
- 5565 Glenn Rd
- 5461 Glenn Rd
- 0 Rockmills Rd Unit 7388796