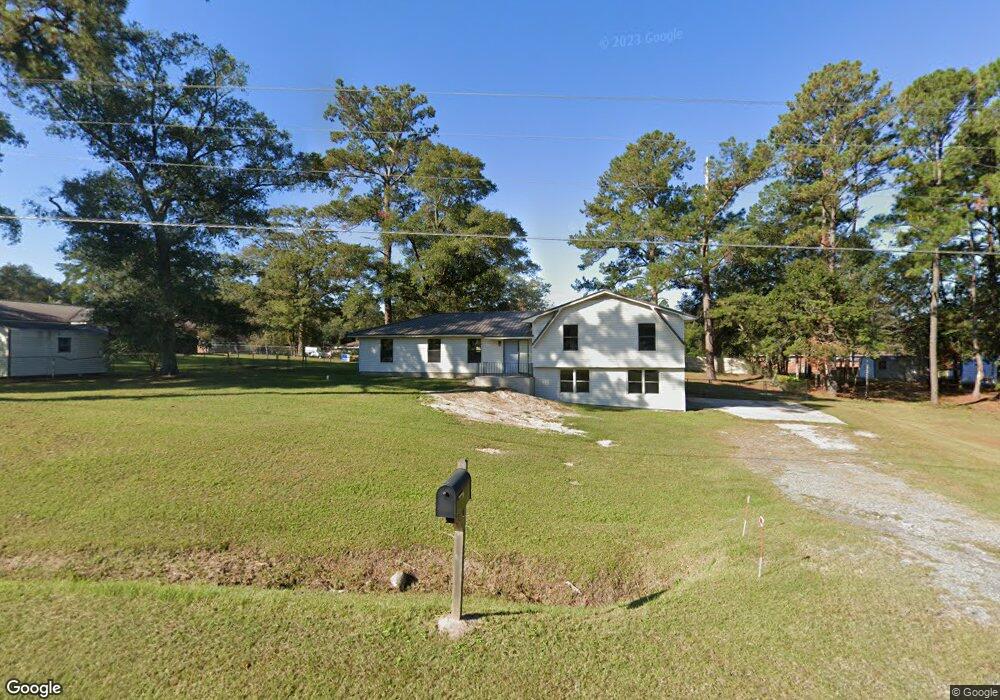
5225 Jamestown Rd Waycross, GA 31503
Estimated Value: $249,000 - $335,000
3
Beds
2
Baths
2,707
Sq Ft
$107/Sq Ft
Est. Value
About This Home
This home is located at 5225 Jamestown Rd, Waycross, GA 31503 and is currently estimated at $289,662, approximately $107 per square foot. 5225 Jamestown Rd is a home located in Ware County with nearby schools including Wacona Elementary School, Ware County Middle School, and Ware County High School.
Ownership History
Date
Name
Owned For
Owner Type
Purchase Details
Closed on
Dec 11, 2023
Sold by
Dietz Llc
Bought by
Taylor Tyler
Current Estimated Value
Purchase Details
Closed on
Jan 3, 2023
Sold by
Pearson Lisa
Bought by
Dietz Llc
Purchase Details
Closed on
Apr 13, 2005
Sold by
Stewart John
Bought by
Pearson Kenneth W and Pearson Lisa M
Home Financials for this Owner
Home Financials are based on the most recent Mortgage that was taken out on this home.
Original Mortgage
$88,870
Interest Rate
5.88%
Mortgage Type
VA
Purchase Details
Closed on
Sep 11, 2002
Sold by
Edmonds Michael S and Edmonds Vanessa
Bought by
Stewart John
Purchase Details
Closed on
May 29, 1998
Sold by
Secretary Of Dept Of
Bought by
Edmonds Michael S
Purchase Details
Closed on
Jan 6, 1998
Sold by
Ge Capital Mort Serv
Bought by
Secretary Of Dept Of
Purchase Details
Closed on
May 17, 1991
Bought by
Mack James E and Mack Janet
Create a Home Valuation Report for This Property
The Home Valuation Report is an in-depth analysis detailing your home's value as well as a comparison with similar homes in the area
Home Values in the Area
Average Home Value in this Area
Purchase History
| Date | Buyer | Sale Price | Title Company |
|---|---|---|---|
| Taylor Tyler | $245,000 | -- | |
| Dietz Llc | $100,200 | -- | |
| Pearson Kenneth W | $87,000 | -- | |
| Stewart John | $80,000 | -- | |
| Edmonds Michael S | -- | -- | |
| Secretary Of Dept Of | $54,600 | -- | |
| Ge Capital Mort Serv | $54,600 | -- | |
| Mack James E | $53,000 | -- |
Source: Public Records
Mortgage History
| Date | Status | Borrower | Loan Amount |
|---|---|---|---|
| Previous Owner | Pearson Kenneth W | $88,870 |
Source: Public Records
Tax History Compared to Growth
Tax History
| Year | Tax Paid | Tax Assessment Tax Assessment Total Assessment is a certain percentage of the fair market value that is determined by local assessors to be the total taxable value of land and additions on the property. | Land | Improvement |
|---|---|---|---|---|
| 2024 | $2,798 | $110,880 | $5,200 | $105,680 |
| 2023 | $2,854 | $54,598 | $2,160 | $52,438 |
| 2022 | $1,273 | $54,598 | $2,160 | $52,438 |
| 2021 | $1,087 | $37,934 | $2,160 | $35,774 |
| 2020 | $1,076 | $36,564 | $2,160 | $34,404 |
| 2019 | $1,073 | $35,195 | $2,160 | $33,035 |
| 2018 | $1,039 | $33,825 | $2,160 | $31,665 |
| 2017 | $1,013 | $33,825 | $2,160 | $31,665 |
| 2016 | $1,013 | $33,073 | $2,160 | $30,913 |
| 2015 | $1,023 | $33,072 | $2,160 | $30,913 |
| 2014 | $1,021 | $33,073 | $2,160 | $30,913 |
| 2013 | -- | $33,072 | $2,160 | $30,912 |
Source: Public Records
Map
Nearby Homes
- 4190 Church Street Extension
- 0 Jamestown Rd Unit 25595234
- 0 Jamestown Rd Unit 25595235
- 0 Jamestown Rd Unit 10575588
- 0 Jamestown Rd Unit 1655675
- 0 Jamestown Rd Unit 25323571
- 5802 River Trail
- 5790 Wooddell Dr
- 5768 Holly Dr
- 3825 Jamestown Rd
- 1691 Huckaby Rd
- 729 Satilla Trail
- 5927 Yellow Bluff Rd
- 3860 Blalock Ave
- 4601 Alma Hwy
- Lot 51 Ridge Loop Rd
- 3648 Tanner Ln
- 5627 Yellow Bluff Rd
- 1621 Meadowood Dr
- 6005 & 6007 Tree Top Ln
- 2310 Spring St
- 5226 Briarcliff Dr
- 5208 Briarcliff Dr
- 5248 Briarcliff Dr
- 2317 Spring St
- 2305 Spring St
- 2327 Spring St
- 5211 Briarcliff Dr
- 0 Jamestown Rd
- 5231 Briarcliff Dr
- 5170 Abc Ave
- 2349 Spring St
- 5264 Briarcliff Dr
- 5203 Jamestown Rd
- 5150 Abc Ave
- 2394 Spring St
- 5264 Kingsfield Dr
- 2383 Spring St
- 5248 Kingsfield Dr
- 5201 Jamestown Rd