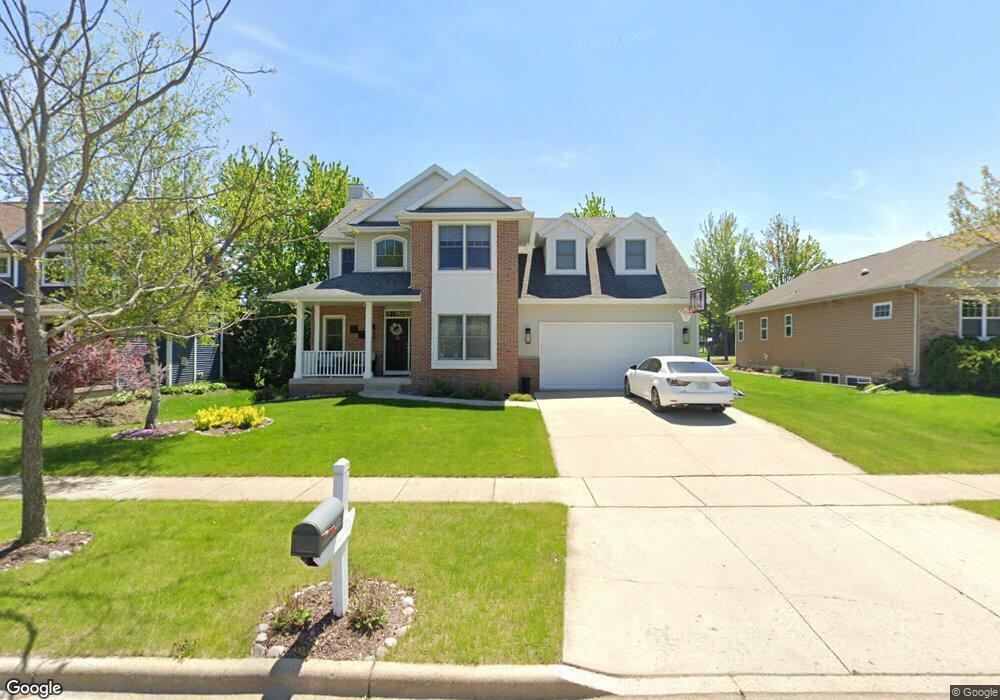
5225 Nannyberry Dr Fitchburg, WI 53711
Estimated Value: $592,382 - $711,000
--
Bed
--
Bath
--
Sq Ft
9,191
Sq Ft Lot
About This Home
This home is located at 5225 Nannyberry Dr, Fitchburg, WI 53711 and is currently estimated at $639,596. 5225 Nannyberry Dr is a home located in Dane County with nearby schools including Leopold Elementary School, Cherokee Heights Middle School, and West High School.
Ownership History
Date
Name
Owned For
Owner Type
Purchase Details
Closed on
Nov 8, 2016
Sold by
Lax Chad T
Bought by
Lax Maria
Current Estimated Value
Home Financials for this Owner
Home Financials are based on the most recent Mortgage that was taken out on this home.
Original Mortgage
$224,960
Outstanding Balance
$180,888
Interest Rate
3.47%
Mortgage Type
New Conventional
Estimated Equity
$458,708
Purchase Details
Closed on
Jun 30, 2006
Sold by
Kegonsa Builders Inc
Bought by
Lax Chad T and Lax Maria
Home Financials for this Owner
Home Financials are based on the most recent Mortgage that was taken out on this home.
Original Mortgage
$279,900
Interest Rate
6.73%
Mortgage Type
New Conventional
Purchase Details
Closed on
Jan 28, 2005
Sold by
Fitchburg Lands Llc
Bought by
Kegonsa Builders Inc
Home Financials for this Owner
Home Financials are based on the most recent Mortgage that was taken out on this home.
Original Mortgage
$68,900
Interest Rate
5.79%
Mortgage Type
Future Advance Clause Open End Mortgage
Create a Home Valuation Report for This Property
The Home Valuation Report is an in-depth analysis detailing your home's value as well as a comparison with similar homes in the area
Home Values in the Area
Average Home Value in this Area
Purchase History
| Date | Buyer | Sale Price | Title Company |
|---|---|---|---|
| Lax Maria | -- | First American Title | |
| Lax Chad T | $349,900 | None Available | |
| Kegonsa Builders Inc | $68,900 | None Available |
Source: Public Records
Mortgage History
| Date | Status | Borrower | Loan Amount |
|---|---|---|---|
| Open | Lax Maria | $224,960 | |
| Closed | Lax Chad T | $279,900 | |
| Previous Owner | Kegonsa Builders Inc | $68,900 |
Source: Public Records
Tax History Compared to Growth
Tax History
| Year | Tax Paid | Tax Assessment Tax Assessment Total Assessment is a certain percentage of the fair market value that is determined by local assessors to be the total taxable value of land and additions on the property. | Land | Improvement |
|---|---|---|---|---|
| 2024 | $8,957 | $530,100 | $82,300 | $447,800 |
| 2023 | $8,504 | $439,800 | $82,300 | $357,500 |
| 2021 | $8,400 | $390,500 | $72,800 | $317,700 |
| 2020 | $8,128 | $390,500 | $72,800 | $317,700 |
| 2019 | $8,132 | $379,100 | $70,000 | $309,100 |
| 2018 | $7,657 | $360,700 | $70,000 | $290,700 |
| 2017 | $7,875 | $354,800 | $70,000 | $284,800 |
| 2016 | $8,075 | $350,700 | $70,000 | $280,700 |
| 2015 | $7,819 | $342,500 | $70,000 | $272,500 |
| 2014 | $7,699 | $343,800 | $70,000 | $273,800 |
| 2013 | $7,549 | $343,800 | $70,000 | $273,800 |
Source: Public Records
Map
Nearby Homes
- 2814 Big Bluestem Pkwy
- 2822 Big Bluestem Pkwy
- 2810 Big Bluestem Pkwy
- 2818 Big Bluestem Pkwy
- 2806 Big Bluestem Pkwy
- 5231 Blazingstar Ln
- 5205 Teaberry Ln Unit 3
- 5225 Sassafras Dr
- 5229 Sassafras Dr
- 5233 Sassafras Dr
- 5215 Sassafras Dr
- 5217 Sassafras Dr
- 5221 Sassafras Dr
- 5223 Sassafras Dr
- 5227 Sassafras Dr
- 5231 Sassafras Dr
- 5219 Sassafras Dr
- 2813 Crinkle Root Dr
- 2811 Crinkle Root Dr
- 5192 Sassafras Dr Unit 109
- 5229 Nannyberry Dr
- 5221 Nannyberry Dr
- 5217 Nannyberry Dr
- 2854 Big Bluestem Pkwy
- 5224 Nannyberry Dr
- 5230 Day Lily Place
- 5220 Nannyberry Dr
- 5226 Day Lily Place
- 5236 Day Lily Place
- 5213 Nannyberry Dr
- 5222 Day Lily Place
- 2860 Big Bluestem Pkwy
- 5216 Nannyberry Dr
- 2850 Big Bluestem Pkwy
- 5218 Day Lily Place
- 5209 Nannyberry Dr
- 2864 Big Bluestem Pkwy
- 5221 Blazingstar Ln
- 5212 Nannyberry Dr
- 5225 Blazingstar Ln