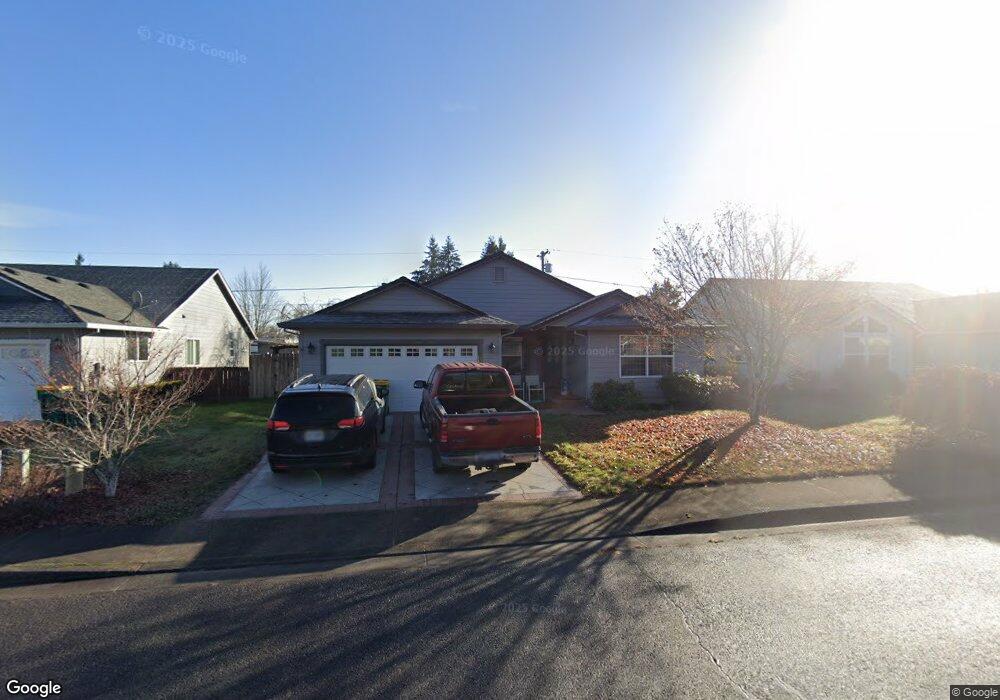
52254 SE Tyler St Scappoose, OR 97056
Estimated Value: $483,333 - $523,000
4
Beds
2
Baths
1,746
Sq Ft
$292/Sq Ft
Est. Value
About This Home
This home is located at 52254 SE Tyler St, Scappoose, OR 97056 and is currently estimated at $510,083, approximately $292 per square foot. 52254 SE Tyler St is a home located in Columbia County with nearby schools including Scappoose High School, South Columbia Family School, and Scappoose Adventist School.
Ownership History
Date
Name
Owned For
Owner Type
Purchase Details
Closed on
Feb 9, 2017
Sold by
Gentry Megan
Bought by
Conard Adam E and Conard Kathryn J
Current Estimated Value
Home Financials for this Owner
Home Financials are based on the most recent Mortgage that was taken out on this home.
Original Mortgage
$278,385
Outstanding Balance
$229,380
Interest Rate
4.2%
Mortgage Type
FHA
Estimated Equity
$280,703
Purchase Details
Closed on
Sep 24, 2011
Sold by
Nott Patti Lynn
Bought by
Gillett Barbara and Gillett Revocable Living Trust
Purchase Details
Closed on
Aug 15, 2011
Sold by
Lordos William H and Lordos Patricia A
Bought by
Johnson Cindy and Gillett Barbara
Purchase Details
Closed on
Aug 25, 2004
Sold by
Strobel Merril G and Strobel Rosanne
Bought by
Lordos William H and Lordos Patricia A
Create a Home Valuation Report for This Property
The Home Valuation Report is an in-depth analysis detailing your home's value as well as a comparison with similar homes in the area
Home Values in the Area
Average Home Value in this Area
Purchase History
| Date | Buyer | Sale Price | Title Company |
|---|---|---|---|
| Conard Adam E | $283,522 | Ticor Title Company Of Or | |
| Gillett Barbara | -- | None Available | |
| Gillett Barbara | -- | None Available | |
| Gillett Barbara | -- | None Available | |
| Johnson Cindy | $235,000 | Ticor Title | |
| Lordos William H | $199,000 | Ticor Title |
Source: Public Records
Mortgage History
| Date | Status | Borrower | Loan Amount |
|---|---|---|---|
| Open | Conard Adam E | $278,385 |
Source: Public Records
Tax History Compared to Growth
Tax History
| Year | Tax Paid | Tax Assessment Tax Assessment Total Assessment is a certain percentage of the fair market value that is determined by local assessors to be the total taxable value of land and additions on the property. | Land | Improvement |
|---|---|---|---|---|
| 2025 | $4,671 | $267,260 | $92,120 | $175,140 |
| 2024 | $4,550 | $259,480 | $89,440 | $170,040 |
| 2023 | $4,511 | $251,930 | $92,360 | $159,570 |
| 2022 | $4,336 | $244,600 | $89,670 | $154,930 |
| 2021 | $4,222 | $237,480 | $93,030 | $144,450 |
| 2020 | $3,932 | $230,570 | $90,730 | $139,840 |
| 2019 | $3,838 | $223,860 | $86,730 | $137,130 |
| 2018 | $3,782 | $217,340 | $92,670 | $124,670 |
| 2017 | $3,718 | $211,010 | $89,970 | $121,040 |
| 2016 | $3,687 | $204,870 | $87,350 | $117,520 |
| 2015 | $3,516 | $198,910 | $71,750 | $127,160 |
| 2014 | $3,411 | $193,120 | $64,920 | $128,200 |
Source: Public Records
Map
Nearby Homes
- 52269 SE Tyler St
- 52238 Teakwood Dr
- 52144 SE 8th St
- 52256 SE 6th Ct
- 52171 Casswell Dr
- 51587 SE Oak St
- 51425 SE Oak St Unit 65
- 52407 NE 14th St
- 52036 SE Icenogle Loop
- 51784 SE 9th St
- 34579 E Columbia Ave
- 51692 SE 3rd St
- 51925 Columbia River Hwy
- 52866 NE 2nd St
- 51540 SE Westlake Dr Unit 56
- 33375 SW Rokin Way
- 33363 SW Rokin Way
- 33370 SW Rokin Way
- 33358 SW Rokin Way
- 33344 SW Rokin Way
- 52264 SE Tyler St
- 52244 SE Tyler St
- 52251 Teakwood Dr Unit 4
- 52251 Teakwood Dr
- 52274 SE Tyler St
- 52234 SE Tyler St
- 52249 SE Tyler St
- 52227 Teakwood Dr
- 52227 Teakwood Dr
- 52259 SE Tyler St
- 52211 Teakwood Dr
- 52239 SE Tyler St
- 52284 SE Tyler St
- 52224 SE Tyler St
- 52279 SE Tyler St
- 52281 Teakwood Dr
- 52228 Teakwood Dr
- 52229 SE Tyler St
- 52229 Village Way
- 52287 SE Tyler St