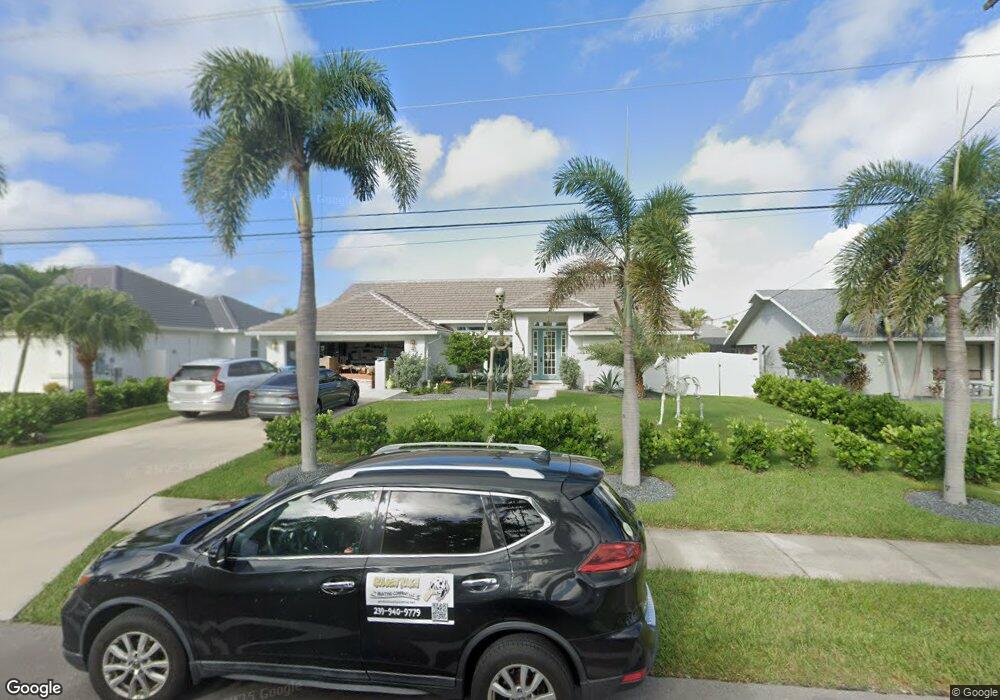
5226 Sands Blvd Cape Coral, FL 33914
Pelican NeighborhoodEstimated Value: $721,000 - $949,000
3
Beds
2
Baths
3,072
Sq Ft
$277/Sq Ft
Est. Value
About This Home
This home is located at 5226 Sands Blvd, Cape Coral, FL 33914 and is currently estimated at $849,958, approximately $276 per square foot. 5226 Sands Blvd is a home located in Lee County with nearby schools including Cape Elementary School, Caloosa Elementary School, and Tropic Isles Elementary School.
Ownership History
Date
Name
Owned For
Owner Type
Purchase Details
Closed on
Oct 12, 2020
Sold by
Cox Trevor E and Cox Courtney
Bought by
Clisch Alan and Clisch Marlene Dixon
Current Estimated Value
Home Financials for this Owner
Home Financials are based on the most recent Mortgage that was taken out on this home.
Original Mortgage
$505,750
Outstanding Balance
$449,838
Interest Rate
2.9%
Mortgage Type
New Conventional
Estimated Equity
$400,120
Purchase Details
Closed on
May 4, 2018
Sold by
Adrian Roger J and Adrian Roger
Bought by
Cox Trevor E and Cox Courtney L
Home Financials for this Owner
Home Financials are based on the most recent Mortgage that was taken out on this home.
Original Mortgage
$431,360
Interest Rate
4.44%
Mortgage Type
New Conventional
Purchase Details
Closed on
Feb 20, 2003
Sold by
Sexton Preston T and Sexton Nancy C
Bought by
Remus Daylen and Remus Tiffany
Home Financials for this Owner
Home Financials are based on the most recent Mortgage that was taken out on this home.
Original Mortgage
$130,500
Interest Rate
5.89%
Mortgage Type
Purchase Money Mortgage
Purchase Details
Closed on
Apr 28, 2000
Sold by
Oliver David G and Oliver Patricia A
Bought by
Adrian Roger J and Adrian Mary L
Create a Home Valuation Report for This Property
The Home Valuation Report is an in-depth analysis detailing your home's value as well as a comparison with similar homes in the area
Home Values in the Area
Average Home Value in this Area
Purchase History
| Date | Buyer | Sale Price | Title Company |
|---|---|---|---|
| Clisch Alan | $595,000 | Attorney | |
| Cox Trevor E | $479,400 | Title Professionals Of Flori | |
| Remus Daylen | $145,000 | -- | |
| Adrian Roger J | $217,000 | -- |
Source: Public Records
Mortgage History
| Date | Status | Borrower | Loan Amount |
|---|---|---|---|
| Open | Clisch Alan | $505,750 | |
| Previous Owner | Cox Trevor E | $431,360 | |
| Previous Owner | Remus Daylen | $130,500 |
Source: Public Records
Tax History Compared to Growth
Tax History
| Year | Tax Paid | Tax Assessment Tax Assessment Total Assessment is a certain percentage of the fair market value that is determined by local assessors to be the total taxable value of land and additions on the property. | Land | Improvement |
|---|---|---|---|---|
| 2025 | $6,981 | $443,594 | -- | -- |
| 2024 | $11,666 | $431,092 | -- | -- |
| 2023 | $11,666 | $585,217 | $0 | $0 |
| 2022 | $10,189 | $532,015 | $0 | $0 |
| 2021 | $8,986 | $483,650 | $371,448 | $112,202 |
| 2020 | $7,996 | $451,094 | $0 | $0 |
| 2019 | $7,767 | $440,095 | $303,400 | $136,695 |
| 2018 | $6,242 | $348,502 | $0 | $0 |
| 2017 | $6,194 | $339,542 | $0 | $0 |
| 2016 | $6,107 | $397,903 | $309,128 | $88,775 |
| 2015 | $6,196 | $413,698 | $245,237 | $168,461 |
| 2014 | -- | $355,712 | $232,343 | $123,369 |
| 2013 | -- | $348,585 | $210,255 | $138,330 |
Source: Public Records
Map
Nearby Homes
- 5205 Sands Blvd
- 5302 SW 27th Place
- 5305 Sands Blvd
- 5312 SW 28th Place
- 5239 SW 27th Ave
- 5323 SW 28th Place
- 5327 SW 28th Place
- 2611 SW 52nd Terrace
- 5328 SW 28th Place
- 2702 SW 53rd Ln
- 2628 SW 53rd Ln
- 5303 SW 26th Ct
- 5413 SW 28th Place Unit 46
- 2849 SW 50th Terrace
- 2516 SW 52nd Terrace
- 2517 SW 52nd St
- 4918 SW 27th Ave
- 5310 SW 25th Ct
- 2505 SW 53rd Terrace
- 5003 SW 26th Ave
- 5226 Sands Blvd
- 5222 Sands Blvd
- 5230 Sands Blvd
- 5218 Sands Blvd
- 5234 Sands Blvd
- 5221 Sands Blvd
- 5225 Sands Blvd
- 5238 Sands Blvd
- 5214 Sands Blvd Unit 72
- 5229 Sands Blvd
- 5217 Sands Blvd
- 5235 Sands Blvd
- 5213 Sands Blvd
- 5227 SW 28th Place
- 5223 SW 28th Place
- 5242 Sands Blvd
- 5224 SW 27th Place
- 5231 SW 28th Place
- 5228 SW 27th Place
- 5220 SW 27th Place