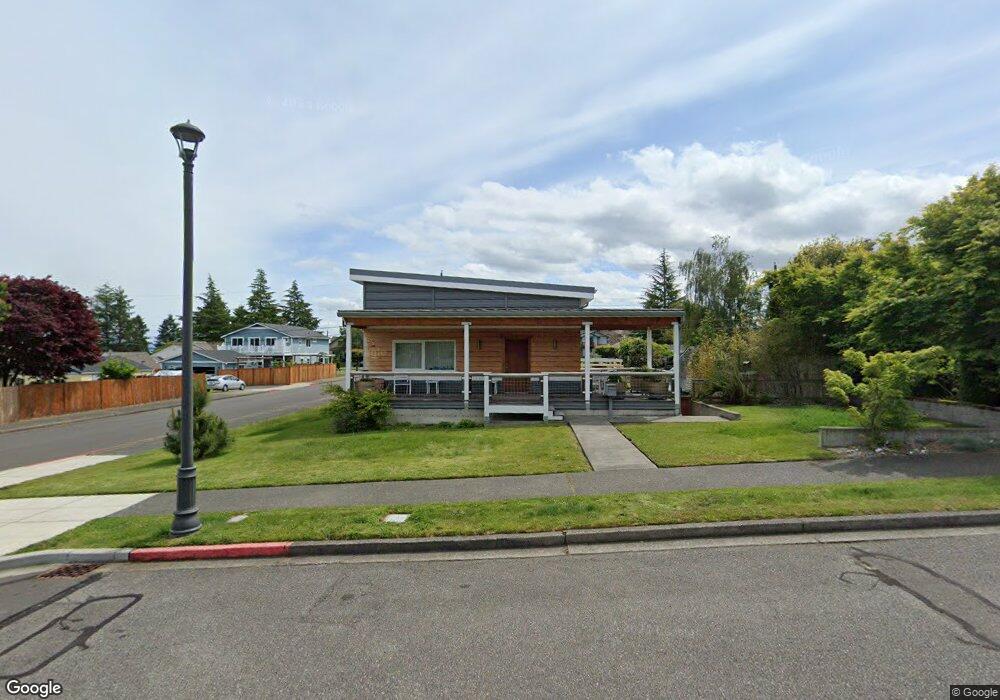
5227 N Highland St Ruston, WA 98407
Estimated Value: $594,456 - $788,000
3
Beds
2
Baths
1,048
Sq Ft
$652/Sq Ft
Est. Value
About This Home
This home is located at 5227 N Highland St, Ruston, WA 98407 and is currently estimated at $683,364, approximately $652 per square foot. 5227 N Highland St is a home located in Pierce County with nearby schools including Point Defiance Elementary School, Truman Middle School, and Dr. Dolores Silas High School.
Ownership History
Date
Name
Owned For
Owner Type
Purchase Details
Closed on
Jun 10, 2009
Sold by
The Bank Of New York
Bought by
Stanley Ron and Stanley Sharon
Current Estimated Value
Home Financials for this Owner
Home Financials are based on the most recent Mortgage that was taken out on this home.
Original Mortgage
$197,600
Outstanding Balance
$125,518
Interest Rate
4.87%
Mortgage Type
Purchase Money Mortgage
Estimated Equity
$557,846
Purchase Details
Closed on
Mar 10, 2009
Sold by
Bartlett Joshua C
Bought by
The Bank Of New York
Purchase Details
Closed on
May 24, 2004
Sold by
Fortson William
Bought by
Bartlett Joshua C
Home Financials for this Owner
Home Financials are based on the most recent Mortgage that was taken out on this home.
Original Mortgage
$163,620
Interest Rate
6.05%
Mortgage Type
Purchase Money Mortgage
Create a Home Valuation Report for This Property
The Home Valuation Report is an in-depth analysis detailing your home's value as well as a comparison with similar homes in the area
Home Values in the Area
Average Home Value in this Area
Purchase History
| Date | Buyer | Sale Price | Title Company |
|---|---|---|---|
| Stanley Ron | $247,000 | First American Title Ins Co | |
| The Bank Of New York | $210,375 | Fidelity National Title | |
| Bartlett Joshua C | $204,526 | Ticor Title Company |
Source: Public Records
Mortgage History
| Date | Status | Borrower | Loan Amount |
|---|---|---|---|
| Open | Stanley Ron | $197,600 | |
| Previous Owner | Bartlett Joshua C | $163,620 | |
| Closed | Bartlett Joshua C | $40,906 |
Source: Public Records
Tax History
| Year | Tax Paid | Tax Assessment Tax Assessment Total Assessment is a certain percentage of the fair market value that is determined by local assessors to be the total taxable value of land and additions on the property. | Land | Improvement |
|---|---|---|---|---|
| 2025 | $5,414 | $628,400 | $341,500 | $286,900 |
| 2024 | $5,414 | $609,000 | $329,600 | $279,400 |
| 2023 | $5,414 | $578,500 | $285,900 | $292,600 |
| 2022 | $4,934 | $592,900 | $306,000 | $286,900 |
| 2021 | $4,634 | $426,200 | $194,800 | $231,400 |
| 2019 | $3,758 | $392,100 | $164,400 | $227,700 |
| 2018 | $4,201 | $362,800 | $148,300 | $214,500 |
| 2017 | $3,637 | $325,500 | $113,600 | $211,900 |
| 2016 | $3,140 | $203,700 | $85,900 | $117,800 |
| 2014 | $2,541 | $212,400 | $82,600 | $129,800 |
| 2013 | $2,541 | $194,500 | $74,000 | $120,500 |
Source: Public Records
Map
Nearby Homes
- 5219 N Winnifred St
- 5207 N Pearl St Unit RUS
- 5302 N Shirley St
- 5217 N Winnifred St
- 5008 N Visscher St
- 5334 N Commercial St
- 5301 N Commercial St
- 4945 N Pearl St
- 4908 N Winnifred St
- 5105 Grand Loop Unit 402
- 5105 Grand Loop Unit 410
- 4916 N Defiance St
- 4917 N Vassault St
- 5302 N 49th St
- 5003 Main St Unit 108
- 5321 N 48th St
- 6 N Mildred St
- 4961 Main St Unit 211
- 4961 Main St Unit 517
- 5512 N 47th St
- 5305 N Highland St
- 5225 N Highland St
- 5301 N Highland St
- 5219 N Highland St
- 5228 N Winnifred St
- 5226 N Winnifred St
- 5311 N Highland St
- 5304 N Winnifred St
- 5226 N Highland St
- 5222 N Highland St
- 5214 N Winnifred St
- 5218 N Highland St
- 5211 N Highland St
- 5308 N Winnifred St
- 5304 N Highland St
- 5315 N Highland St
- 5216 N Highland St
- 5210 N Winnifred St
- 5310 N Highland St
- 5214 N Highland St
Your Personal Tour Guide
Ask me questions while you tour the home.