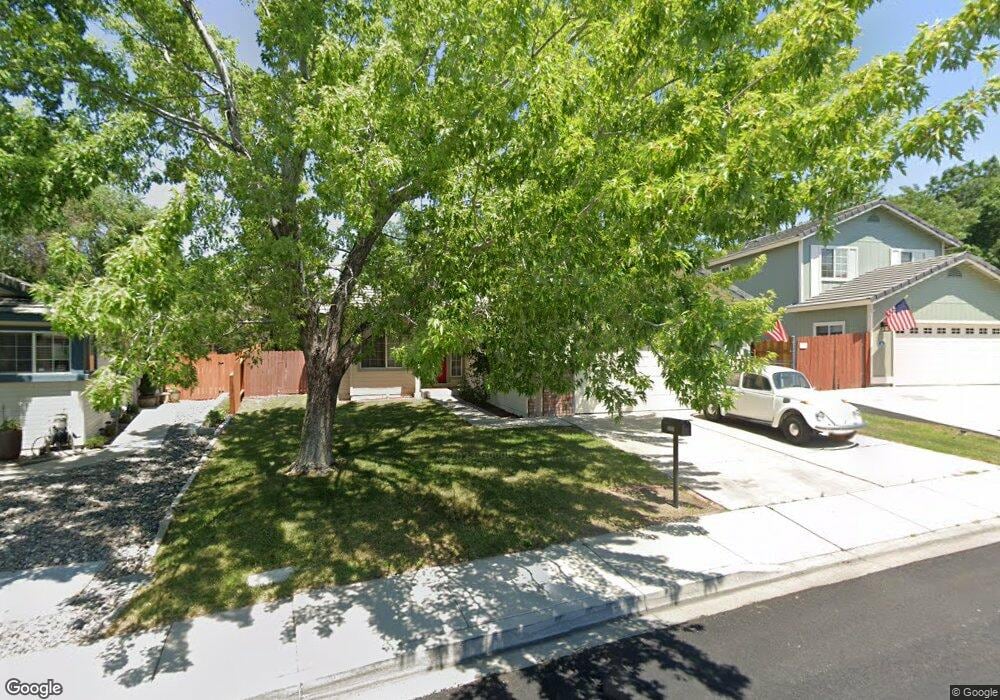
5227 Palo Alto Cir Sparks, NV 89436
Los Altos Parkway NeighborhoodEstimated Value: $513,225 - $531,000
3
Beds
3
Baths
1,590
Sq Ft
$326/Sq Ft
Est. Value
About This Home
This home is located at 5227 Palo Alto Cir, Sparks, NV 89436 and is currently estimated at $518,806, approximately $326 per square foot. 5227 Palo Alto Cir is a home located in Washoe County with nearby schools including Bud Beasley Elementary School, Lou Mendive Middle School, and Edward C Reed High School.
Ownership History
Date
Name
Owned For
Owner Type
Purchase Details
Closed on
Apr 12, 2004
Sold by
Silverman Noel D and Silverman Helene J
Bought by
Hines Michael Colton
Current Estimated Value
Home Financials for this Owner
Home Financials are based on the most recent Mortgage that was taken out on this home.
Original Mortgage
$135,000
Outstanding Balance
$63,130
Interest Rate
5.57%
Mortgage Type
Unknown
Estimated Equity
$455,676
Purchase Details
Closed on
Aug 27, 2002
Sold by
Shepherd Anita C
Bought by
Silverman Noel D and Silverman Helene J
Purchase Details
Closed on
Feb 21, 1996
Sold by
Chapman David S and Malchow Michele I
Bought by
Shepherd Anita C
Home Financials for this Owner
Home Financials are based on the most recent Mortgage that was taken out on this home.
Original Mortgage
$76,100
Interest Rate
7.1%
Purchase Details
Closed on
Jan 17, 1994
Sold by
Chapman Michele I M and Chapman David S
Bought by
Chapman David S and Chapman Michele I M
Create a Home Valuation Report for This Property
The Home Valuation Report is an in-depth analysis detailing your home's value as well as a comparison with similar homes in the area
Home Values in the Area
Average Home Value in this Area
Purchase History
| Date | Buyer | Sale Price | Title Company |
|---|---|---|---|
| Hines Michael Colton | $257,500 | First Centennial Title Co | |
| Silverman Noel D | $186,000 | Stewart Title Northern Nevad | |
| Shepherd Anita C | $151,000 | First Centennial Title Co | |
| Chapman David S | -- | -- |
Source: Public Records
Mortgage History
| Date | Status | Borrower | Loan Amount |
|---|---|---|---|
| Open | Hines Michael Colton | $135,000 | |
| Previous Owner | Shepherd Anita C | $76,100 |
Source: Public Records
Tax History Compared to Growth
Tax History
| Year | Tax Paid | Tax Assessment Tax Assessment Total Assessment is a certain percentage of the fair market value that is determined by local assessors to be the total taxable value of land and additions on the property. | Land | Improvement |
|---|---|---|---|---|
| 2025 | $2,960 | $97,927 | $42,560 | $55,367 |
| 2024 | $2,960 | $96,271 | $40,075 | $56,196 |
| 2023 | $1,898 | $92,080 | $38,710 | $53,370 |
| 2022 | $2,539 | $77,448 | $32,830 | $44,618 |
| 2021 | $2,352 | $68,466 | $23,835 | $44,631 |
| 2020 | $2,211 | $68,695 | $23,800 | $44,895 |
| 2019 | $2,106 | $67,459 | $24,360 | $43,099 |
| 2018 | $2,009 | $60,190 | $17,780 | $42,410 |
| 2017 | $1,936 | $59,064 | $16,450 | $42,614 |
| 2016 | $1,881 | $58,190 | $14,525 | $43,665 |
| 2015 | $1,877 | $56,546 | $12,880 | $43,666 |
| 2014 | $1,819 | $53,139 | $10,885 | $42,254 |
| 2013 | -- | $46,828 | $8,925 | $37,903 |
Source: Public Records
Map
Nearby Homes
- 1716 Canyon Terrace Dr
- 1685 Southview Dr
- 5436 Vista Terrace Ln Unit 2B
- 1560 Freeman Way
- 5276 Santa Rosa Ave
- 1550 Istrice Rd
- 5688 Spandrell Cir
- 4675 Firtree Ln
- 5494 Spandrell Ln Unit 2C
- 1388 Lambrays Ln
- 4601 N Cactus Hills Ct
- 5105 Santa Anita Dr
- 1850 Almonte Ct
- 3693 Vista Blvd
- 5310 Healing Stone Ct
- 4383 Setting Sun Ct Unit 1
- 5345 Energystone Dr
- 2738 Kettle Ct
- 1304 Lambrusca Dr
- 4393 Acobat Ct
- 5225 Palo Alto Cir
- 5229 Palo Alto Cir
- 5231 Palo Alto Cir
- 5223 Palo Alto Cir
- 5111 Canyon Run Dr
- 5125 Canyon Run Dr
- 5089 Canyon Run Dr
- 5141 Canyon Run Dr
- 5228 Palo Alto Cir
- 5071 Canyon Run Dr
- 5224 Palo Alto Cir
- 5233 Palo Alto Cir
- 5230 Palo Alto Cir
- 5221 Palo Alto Cir
- 5155 Canyon Run Dr
- 5045 Canyon Run Dr
- 5220 Palo Alto Cir
- 5169 Canyon Run Dr
- 5234 Palo Alto Cir
- 5031 Canyon Run Dr