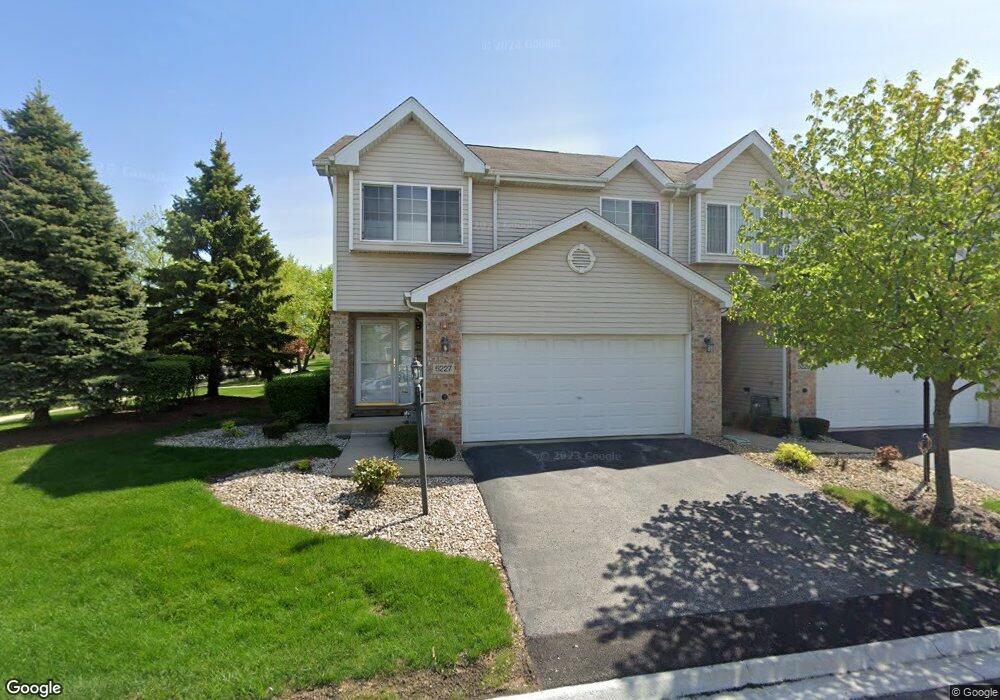
5227 Southwick Ct Matteson, IL 60443
Old Matteson NeighborhoodEstimated Value: $242,735 - $261,000
3
Beds
2
Baths
1,354
Sq Ft
$187/Sq Ft
Est. Value
About This Home
This home is located at 5227 Southwick Ct, Matteson, IL 60443 and is currently estimated at $253,184, approximately $186 per square foot. 5227 Southwick Ct is a home located in Cook County with nearby schools including Colin Powell Middle School and Southland College Prep.
Ownership History
Date
Name
Owned For
Owner Type
Purchase Details
Closed on
Jul 8, 2025
Sold by
Brown E B
Bought by
Gibson-Brown Brown E and Gibson-Brown Barbie A
Current Estimated Value
Purchase Details
Closed on
Aug 19, 2010
Sold by
Wells Fargo Bank National Association
Bought by
Brown E B
Home Financials for this Owner
Home Financials are based on the most recent Mortgage that was taken out on this home.
Original Mortgage
$119,293
Interest Rate
4.62%
Mortgage Type
FHA
Purchase Details
Closed on
Mar 17, 2010
Sold by
Tang Tajuana M
Bought by
Wells Fargo Bank National Association
Purchase Details
Closed on
May 18, 2006
Sold by
Mcclam Dianna L
Bought by
Tang Tajuana M
Home Financials for this Owner
Home Financials are based on the most recent Mortgage that was taken out on this home.
Original Mortgage
$41,000
Interest Rate
6.62%
Mortgage Type
Stand Alone Second
Purchase Details
Closed on
Dec 1, 2003
Sold by
Southwick Courtyards Llc
Bought by
Mcclam Diana L
Home Financials for this Owner
Home Financials are based on the most recent Mortgage that was taken out on this home.
Original Mortgage
$110,000
Interest Rate
5.12%
Mortgage Type
Unknown
Create a Home Valuation Report for This Property
The Home Valuation Report is an in-depth analysis detailing your home's value as well as a comparison with similar homes in the area
Home Values in the Area
Average Home Value in this Area
Purchase History
| Date | Buyer | Sale Price | Title Company |
|---|---|---|---|
| Gibson-Brown Brown E | -- | None Listed On Document | |
| Brown E B | $121,000 | Wheatland Title Guaranty | |
| Wells Fargo Bank National Association | -- | None Available | |
| Tang Tajuana M | $205,000 | Git | |
| Mcclam Diana L | $181,500 | Multiple |
Source: Public Records
Mortgage History
| Date | Status | Borrower | Loan Amount |
|---|---|---|---|
| Previous Owner | Brown E B | $119,293 | |
| Previous Owner | Tang Tajuana M | $41,000 | |
| Previous Owner | Tang Tajuana M | $164,000 | |
| Previous Owner | Mcclam Diana L | $110,000 |
Source: Public Records
Tax History
| Year | Tax Paid | Tax Assessment Tax Assessment Total Assessment is a certain percentage of the fair market value that is determined by local assessors to be the total taxable value of land and additions on the property. | Land | Improvement |
|---|---|---|---|---|
| 2025 | $5,402 | $19,000 | $1,976 | $17,024 |
| 2024 | $5,402 | $19,000 | $1,976 | $17,024 |
| 2023 | $3,922 | $19,000 | $1,976 | $17,024 |
| 2022 | $3,922 | $13,482 | $1,705 | $11,777 |
| 2021 | $2,624 | $13,482 | $1,705 | $11,777 |
| 2020 | $2,362 | $13,482 | $1,705 | $11,777 |
| 2019 | $2,732 | $12,300 | $1,550 | $10,750 |
| 2018 | $2,697 | $12,300 | $1,550 | $10,750 |
| 2017 | $2,576 | $12,300 | $1,550 | $10,750 |
| 2016 | $3,799 | $12,209 | $1,395 | $10,814 |
| 2015 | $3,919 | $12,209 | $1,395 | $10,814 |
| 2014 | $3,859 | $12,209 | $1,395 | $10,814 |
| 2013 | $5,104 | $15,603 | $1,395 | $14,208 |
Source: Public Records
Map
Nearby Homes
- 5226 Southwick Ct Unit 2
- 505 E Illinois St Unit 105
- 5503 Georgetown Dr
- 4862 Bay View Dr
- 4613 Lindenwood Ct
- 763 Cambridge Ave
- 858 Academy Ave
- 22140 Schaaf Ct
- 20813 Homeland Rd
- 997 Regent Dr
- 912 Princeton Ave
- 1010 Regent Dr
- 744 Academy Ave
- 829 Princeton Ave
- 4700 Salem Ct
- 5631 Colgate Ln
- 4459 Balmoral Dr
- 22206 Hawthorne Way
- 5327 Northwestern Dr
- 4443 Ascot Ct
- 5229 Southwick Ct Unit 1
- 5231 Southwick Ct
- 5233 Southwick Ct
- 5226 Stoneridge Ct
- 5228 Stoneridge Ct
- 5228 Stoneridge Ct Unit 5228
- 5235 Southwick Ct
- 5230 Stoneridge Ct
- 5232 Stoneridge Ct
- 5226 Southwick Ct Unit F
- 5230 Southwick Ct Unit 2
- 5237 Southwick Ct
- 5237 Southwick Ct
- 5232 Southwick Ct
- 5232 Southwick Ct Unit 5232
- 5232 Southwick Ct Unit 5238
- 5234 Stoneridge Ct
- 5234 Southwick Ct
- 5236 Stoneridge Ct Unit 1
- 5239 Southwick Ct
Your Personal Tour Guide
Ask me questions while you tour the home.