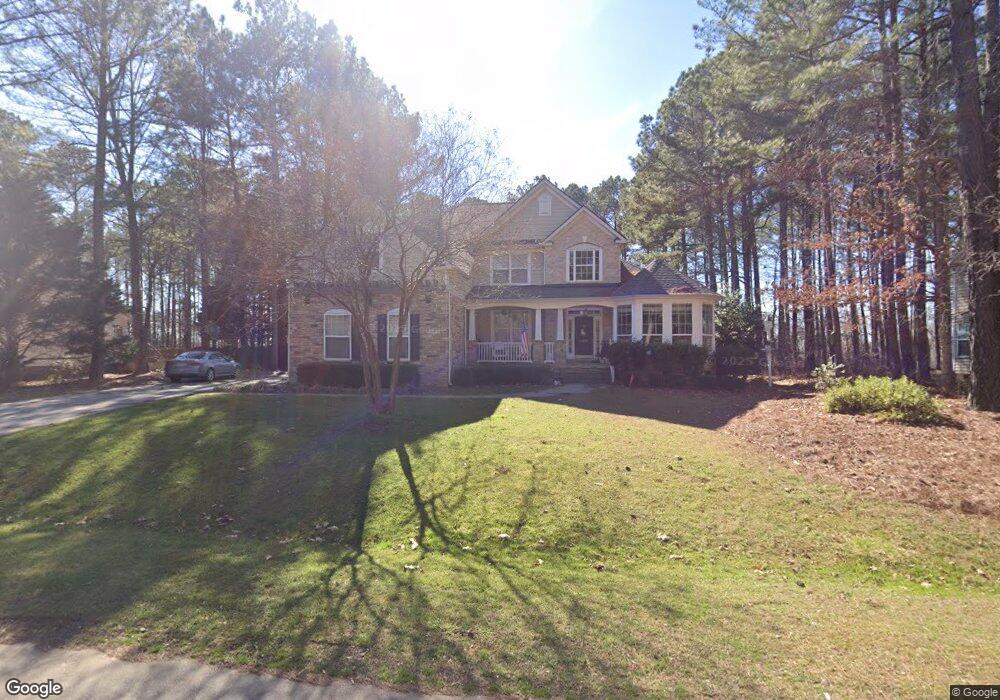
5228 Dutch Elm Dr Apex, NC 27539
Middle Creek NeighborhoodEstimated Value: $736,452 - $796,000
4
Beds
4
Baths
3,491
Sq Ft
$219/Sq Ft
Est. Value
About This Home
This home is located at 5228 Dutch Elm Dr, Apex, NC 27539 and is currently estimated at $764,113, approximately $218 per square foot. 5228 Dutch Elm Dr is a home located in Wake County with nearby schools including Holly Springs Elementary School, Holly Ridge Middle School, and Apex High School.
Ownership History
Date
Name
Owned For
Owner Type
Purchase Details
Closed on
Sep 19, 2014
Sold by
Edwards Richard L and Edwards Laura E
Bought by
Langfeldt Scott A and Langfeldt Jennifer B
Current Estimated Value
Home Financials for this Owner
Home Financials are based on the most recent Mortgage that was taken out on this home.
Original Mortgage
$330,400
Outstanding Balance
$253,502
Interest Rate
4.2%
Mortgage Type
New Conventional
Estimated Equity
$510,611
Purchase Details
Closed on
Oct 24, 2006
Sold by
Romeo Christopher J and Romeo Debra J
Bought by
Edwards Richard L and Edwards Laura E
Home Financials for this Owner
Home Financials are based on the most recent Mortgage that was taken out on this home.
Original Mortgage
$326,000
Interest Rate
6.39%
Mortgage Type
Purchase Money Mortgage
Purchase Details
Closed on
Dec 20, 2004
Sold by
The Drees Co
Bought by
Romeo Christopher J and Romeo Debra J
Home Financials for this Owner
Home Financials are based on the most recent Mortgage that was taken out on this home.
Original Mortgage
$257,000
Interest Rate
5.67%
Mortgage Type
Fannie Mae Freddie Mac
Create a Home Valuation Report for This Property
The Home Valuation Report is an in-depth analysis detailing your home's value as well as a comparison with similar homes in the area
Home Values in the Area
Average Home Value in this Area
Purchase History
| Date | Buyer | Sale Price | Title Company |
|---|---|---|---|
| Langfeldt Scott A | $413,000 | None Available | |
| Edwards Richard L | $407,500 | None Available | |
| Romeo Christopher J | $407,500 | -- |
Source: Public Records
Mortgage History
| Date | Status | Borrower | Loan Amount |
|---|---|---|---|
| Open | Langfeldt Scott A | $330,400 | |
| Previous Owner | Edwards Richard L | $326,000 | |
| Previous Owner | Edwards Richard L | $81,500 | |
| Previous Owner | Romeo Christopher J | $257,000 |
Source: Public Records
Tax History Compared to Growth
Tax History
| Year | Tax Paid | Tax Assessment Tax Assessment Total Assessment is a certain percentage of the fair market value that is determined by local assessors to be the total taxable value of land and additions on the property. | Land | Improvement |
|---|---|---|---|---|
| 2025 | $4,092 | $636,612 | $135,000 | $501,612 |
| 2024 | $3,973 | $636,612 | $135,000 | $501,612 |
| 2023 | $3,692 | $470,933 | $75,000 | $395,933 |
| 2022 | $3,421 | $470,933 | $75,000 | $395,933 |
| 2021 | $3,329 | $470,933 | $75,000 | $395,933 |
| 2020 | $3,274 | $470,933 | $75,000 | $395,933 |
| 2019 | $3,435 | $418,091 | $64,000 | $354,091 |
| 2018 | $3,157 | $418,091 | $64,000 | $354,091 |
| 2017 | $2,993 | $418,091 | $64,000 | $354,091 |
| 2016 | $2,932 | $418,091 | $64,000 | $354,091 |
| 2015 | $3,076 | $440,084 | $70,000 | $370,084 |
| 2014 | -- | $440,084 | $70,000 | $370,084 |
Source: Public Records
Map
Nearby Homes
- 108 Bella Place
- 300 Firefly Rd
- 212 Mystic Pine Place
- 201 Adefield Ln
- 413 Hyannis Dr
- 148 Danesway Dr
- 201 Holmby Ct
- 209 Mayfield Dr
- 317 Commons Dr
- 102 Spring Dove Ln
- 201 Mayfield Dr
- 109 Willow View Ln
- 127 Willow View Ln
- 314 Cabana Dr
- 4724 Sunset Lake Rd
- 105 Arbor Wynds Ct
- 4721 Edwards Dr
- 3332 Colby Chase Dr Unit Lot 3
- 3340 Colby Chase Dr Unit Lot 2
- 1539 N Main St
- 5224 Dutch Elm Dr
- 5300 Dutch Elm Dr
- 5220 Dutch Elm Dr
- 5304 Dutch Elm Dr
- 5225 Dutch Elm Dr
- 5401 Monarch Birch Dr
- 5221 Dutch Elm Dr
- 5305 Dutch Elm Dr
- 5308 Dutch Elm Dr
- 5216 Dutch Elm Dr
- 5405 Monarch Birch Dr
- 5309 Dutch Elm Dr
- 5312 Dutch Elm Dr
- 5217 Dutch Elm Dr
- 5212 Dutch Elm Dr
- 5213 Dutch Elm Dr
- 5316 Dutch Elm Dr
- 5317 Dutch Elm Dr
- 5413 Monarch Birch Dr
- 5320 Dutch Elm Dr