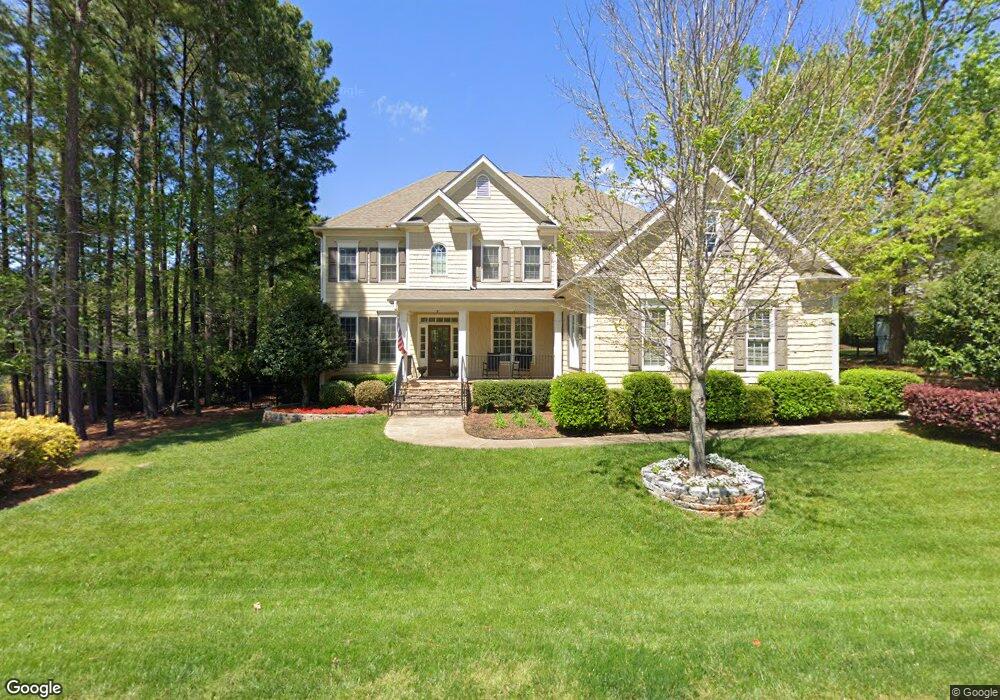
5228 Roswellcrest Ct Unit 91-H Apex, NC 27539
Middle Creek NeighborhoodEstimated Value: $767,366 - $845,000
4
Beds
4
Baths
3,219
Sq Ft
$250/Sq Ft
Est. Value
About This Home
This home is located at 5228 Roswellcrest Ct Unit 91-H, Apex, NC 27539 and is currently estimated at $804,342, approximately $249 per square foot. 5228 Roswellcrest Ct Unit 91-H is a home located in Wake County with nearby schools including West Lake Elementary School, West Lake Middle, and Middle Creek High.
Ownership History
Date
Name
Owned For
Owner Type
Purchase Details
Closed on
Oct 29, 2014
Sold by
Woodworth David Michael and Woodworth Lauren Schambs
Bought by
Boland Teresa M and Boland Kevin John
Current Estimated Value
Home Financials for this Owner
Home Financials are based on the most recent Mortgage that was taken out on this home.
Original Mortgage
$400,500
Outstanding Balance
$307,422
Interest Rate
4.29%
Mortgage Type
New Conventional
Estimated Equity
$496,920
Purchase Details
Closed on
May 13, 2008
Sold by
L & L Of Raleigh Inc
Bought by
Woodworth David Michael and Woodworth Lauren Schambs
Home Financials for this Owner
Home Financials are based on the most recent Mortgage that was taken out on this home.
Original Mortgage
$343,920
Interest Rate
5.82%
Mortgage Type
Purchase Money Mortgage
Create a Home Valuation Report for This Property
The Home Valuation Report is an in-depth analysis detailing your home's value as well as a comparison with similar homes in the area
Home Values in the Area
Average Home Value in this Area
Purchase History
| Date | Buyer | Sale Price | Title Company |
|---|---|---|---|
| Boland Teresa M | $445,000 | None Available | |
| Woodworth David Michael | $430,000 | None Available |
Source: Public Records
Mortgage History
| Date | Status | Borrower | Loan Amount |
|---|---|---|---|
| Open | Boland Teresa M | $400,500 | |
| Previous Owner | Woodworth David Michael | $343,920 |
Source: Public Records
Tax History Compared to Growth
Tax History
| Year | Tax Paid | Tax Assessment Tax Assessment Total Assessment is a certain percentage of the fair market value that is determined by local assessors to be the total taxable value of land and additions on the property. | Land | Improvement |
|---|---|---|---|---|
| 2025 | $6,101 | $709,450 | $140,000 | $569,450 |
| 2024 | $5,969 | $709,450 | $140,000 | $569,450 |
| 2023 | $4,839 | $480,937 | $70,000 | $410,937 |
| 2022 | $4,659 | $480,937 | $70,000 | $410,937 |
| 2021 | $4,565 | $480,937 | $70,000 | $410,937 |
| 2020 | $4,589 | $480,937 | $70,000 | $410,937 |
| 2019 | $4,715 | $438,478 | $65,000 | $373,478 |
| 2018 | $4,424 | $438,478 | $65,000 | $373,478 |
| 2017 | $4,251 | $438,478 | $65,000 | $373,478 |
| 2016 | $4,188 | $438,478 | $65,000 | $373,478 |
| 2015 | $4,107 | $415,134 | $52,000 | $363,134 |
| 2014 | $3,872 | $415,134 | $52,000 | $363,134 |
Source: Public Records
Map
Nearby Homes
- 7404 Bedford Ridge Dr
- 5340 Serene Forest Dr
- 8401 Piney Branch Dr
- 333 Calvander Ln
- 120 Corapeake Way
- 124 Corapeake Way
- 128 Corapeake Way
- 104 Corapeake Way
- 6025 Larboard Dr
- 409 Wanderview Ln
- 7381 Capulin Crest Dr
- 112 Skygrove Dr
- 113 Middlegreen Place
- 5045 Homeplace Dr
- 204 Edgepine Dr
- 129 Middlegreen Place
- 436 Edgepine Dr
- 804 Blue Thorn Dr
- 213 Cross Oaks Place
- 102 Jamison Woods Ln
- 5228 Roswellcrest Ct
- 5224 Roswellcrest Ct
- 5224 Roswellcrest Ct Unit 92-H
- 7309 Bedford Ridge Dr
- 5233 Roswellcrest Ct
- 5233 Roswellcrest Ct Unit L50
- 7269 Bedford Ridge Dr
- 5220 Roswellcrest Ct
- 5225 Roswellcrest Ct
- 5225 Roswellcrest Ct Unit L121H
- 7277 Bedford Ridge Dr
- 7273 Bedford Ridge Dr
- 7329 Bedford Ridge Dr
- 7265 Bedford Ridge Dr
- 5216 Roswellcrest Ct
- 5221 Roswellcrest Ct
- 5221 Roswellcrest Ct Unit L120H
- 7304 Bedford Ridge Dr
- 5252 Greymoss Ln
- 7312 Bedford Ridge Dr