NOT LISTED FOR SALE

5229 & 5227 N Montclair Peoria Heights, IL 61616

Estimated Value: $186,000 - $223,694

5 Beds
3 Baths
10,951 Sq Ft
$19/Sq Ft Est. Value

Last Sold April 28, 2017

Last sale price $455,000 $42 Per Sq Ft

Current estimated payment $1,540/month

About This Home

As of April 2017

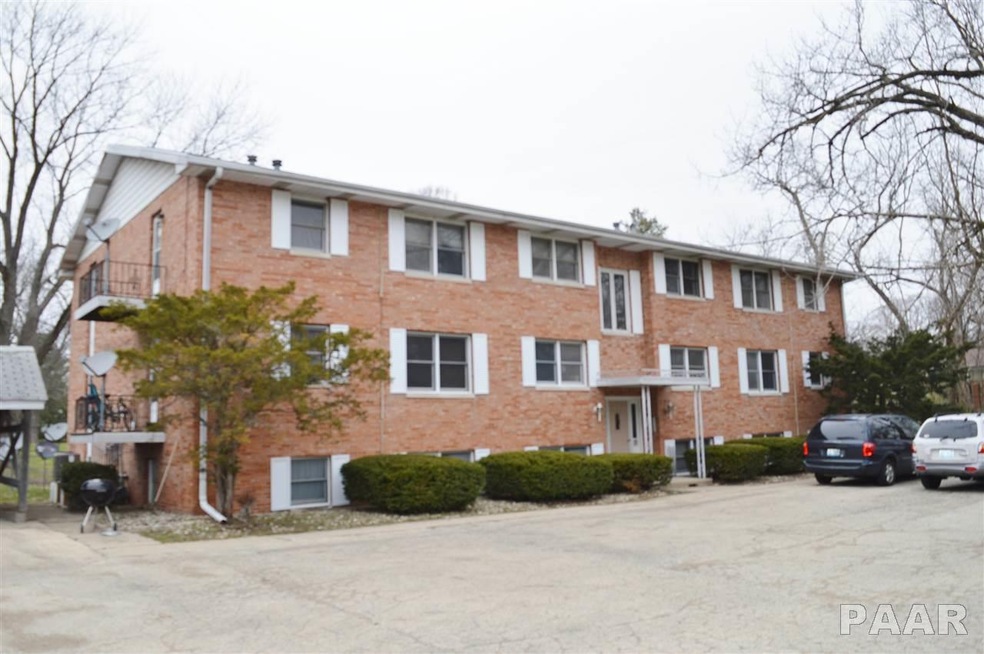
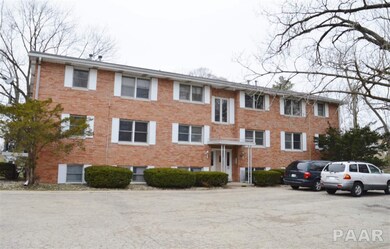
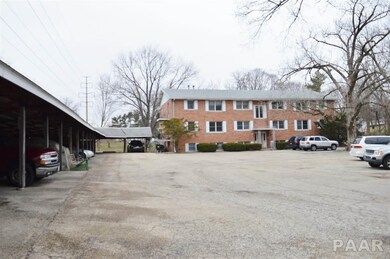
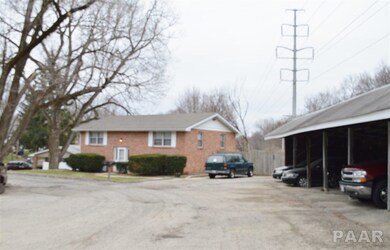
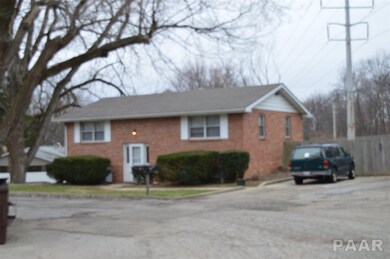
PROPERTY CONSISTS OF TWO (2) BUILDINGS, ONE BRICK AND ALUM SIDED 12 UNIT APARTMENT QUIET LOCATION OFF MAIN ROAD. BUILDING AND ONE ALL BRICK DUPLEX. THERE ARE 15 CARPORTS AND ADDITIONAL PARKING SPACES. EACH DUPLEX UNIT HAS LAUNDRY HOOKUPS, PATIO, AND 2 BEDROOMS. 8 ONE (1) BEDROOM UNITS IN THE MAIN BUILDING AND FOUR (4) TWO BEDROOM UNITS. THERE IS A LAUNDRY IN THE MAIN BUILDING. TENANT PAYS GAS AND ELECTRIC. LANDLORD PAYS FOR WATER. THERE ARE 2 NEWER WATER HEATERS. All information approximate.

Last Agent to Sell the Property

Charlie Crump

Century 21 Lincoln National Realty License #475146666 Listed on: 03/23/2017

Century 21 Lincoln National Realty

Last Buyer's Agent

Brian Monge

Jim Maloof Realty, Inc. License #475124221

Jim Maloof Realty, Inc.

Property Details

Home Type

  • Multi-Family

Est. Annual Taxes

  • $17,880

Year Built

  • Built in 1970

Lot Details

  • 0.75

Basement

  • Partial Basement

Schools

  • Peoria Heights High School

Listing and Financial Details

  • Tenant pays for gas & electric

Property Details

Home Type

Multi-Family

Est. Annual Taxes

$17,880

Year Built

Built in 1970

Lot Details

0

Listing Details

  • Class: Multi-Family
  • Type: Residential Income
  • Style: Apartment Building
  • Legal Description: Lots 15-17 BLK 18 and Lots 59 & 60
  • Lvt Date: 03/24/2017
  • Year Built: 1970
  • Special Features: None
  • Property Sub Type: MultiFamily

Interior Features

  • Basement: Partial
  • Price Per Sq Ft: 41.55
  • Total Sq Ft: 10951

Exterior Features

  • Exterior: Aluminum Siding, Brick

Garage/Parking

  • Garage Parking: Carport, Guest Parking
  • Number Parking Spaces: 22

Utilities

  • Heating Cooling: Forced Air, Gas, Central Air
  • Water Sewer: Public Sewer, Public Water
  • Garbage Collection Exp: 1584
  • Gas Expense: 1200
  • Laundry Facilities: Common, Owned Equipment

Schools

  • High School: Peoria Heights

Lot Info

  • Estimated Lot Size: IRR
  • Estimated Number of Acres: 0.75
  • Lot Description: Cul-De-Sac, Level
  • Subdivision: Morningside
  • Geo Subdivision: IL

Rental Info

  • Tenant Pays: Gas & Electric
  • Gross Annual Rent Income: 86400
  • Lease Information: 1 Year, Month-To-Month, Various Terms

Tax Info

  • Annual Taxes: 17880.24
  • Parcel Id Number Tax Id: 1421227019 & 231-001
  • Tax Year: 2015

Multi Family

  • Total Number Units: 14
  • Gross Annual Income: 86400
  • Total Number Central Air Units: 14
  • Total Number Electric Meters: 15
  • Total Number Gas Meters: 15
  • Total Number Heating Units: 14
  • Total Number Water Heaters: 4
  • Total Number Water Meters: 3

Ownership History

Date Name Owned For Owner Type

Purchase Details

Listed on
Mar 23, 2017
Closed on
Apr 26, 2017
Sold by
Shu Chang and Shu Pei
Bought by
Bjm Homes Llc
Seller's Agent
Charlie Crump
Century 21 Lincoln National Realty
Buyer's Agent
Brian Monge
Jim Maloof Realty, Inc.
List Price
$490,000
Sold Price
$455,000
Premium/Discount to List
-$35,000
-7.14%
Current Estimated Value
$209,174

Home Financials for this Owner

Home Financials are based on the most recent Mortgage that was taken out on this home.
Estimated Appreciation
-$245,826
Avg. Annual Appreciation
-8.68%
Source: Public Records

Range of Values:

Collateral Analytics

Collateral Analytics Collateral Analytics AVMs (Automated Valuation Model) employ a number of statistical approaches combined with neighborhood-specific comparable selection guarantees the most up-to-date and precise valuations.

Not Available

Collateral Analytics does not have data for the current month. Please view the chart for historical values.

ICE

ICE Mortgage Technology ICE Mortgage Technology’s AVM (Automated Valuation Model) is a state-of-the-art online residential property valuation tool that provides a quick and accurate estimate of the value of almost any home in the U.S.

Not Available

ICE Mortgage Technology does not have data for the current month. Please view the chart for historical values.

First American

First American First American Data & Analytics’ next-generation AVM combines unrivaled data assets with a blended ensemble of valuation models to produce highly accurate, reliable valuations you can trust.

Not Available

First American does not have data for the current month. Please view the chart for historical values.

Quantarium

Quantarium Quantarium’s valuation service, repeatedly proven the industry’s most accurate and comprehensive, is supercharged with a self-learning and auto-tuning AI engine that continually becomes smarter and more accurate as it processes daily inputs from the industry’s leading RE data lake.

Not Available

Quantarium does not have data for the current month. Please view the chart for historical values.

Average Value
Not Available
List Price
Sold Price
Create a Home Valuation Report for This Property
The Home Valuation Report is an in-depth analysis detailing your home's value as well as a comparison with similar homes in the area

Home Values in the Area

Source: Public Records

Average Home Value in this Area


Source: Public Records

Purchase History

Date Buyer Sale Price Title Company
Bjm Homes Llc $455,000 --
Source: Public Records

Property History

Date Event Price List to Sale Price per Sq Ft
04/28/2017 04/28/17 Sold $455,000 -7.1% $42 / Sq Ft
03/27/2017 03/27/17 Pending -- -- --
03/23/2017 03/23/17 For Sale $490,000 -- $45 / Sq Ft
Source: RMLS Alliance

Tax History Compared to Growth

Source: Public Records

Tax History

Year Tax Paid Tax Assessment Tax Assessment Total Assessment is a certain percentage of the fair market value that is determined by local assessors to be the total taxable value of land and additions on the property. Land Improvement
2024 $5,258 $61,570 $10,560 $51,010
2023 $5,062 $56,490 $9,690 $46,800
2022 $4,756 $51,840 $9,010 $42,830
2021 $4,612 $49,370 $8,580 $40,790
2020 $4,711 $48,400 $8,410 $39,990
2019 $4,692 $48,400 $8,410 $39,990
2018 $4,659 $48,360 $8,150 $40,210
2017 $4,723 $49,350 $8,320 $41,030
2016 $4,630 $49,350 $8,320 $41,030
2015 $4,123 $49,350 $8,320 $41,030
2014 $4,170 $44,420 $8,020 $36,400
2013 -- $44,640 $8,060 $36,580
Source: Public Records

Agents Affiliated with this Home

  • Section Image
  • Section Image
See All Agents

Map

Source: RMLS Alliance

MLS Number: RMAPA1182092

RMLS Alliance

APN: 14-21-231-001