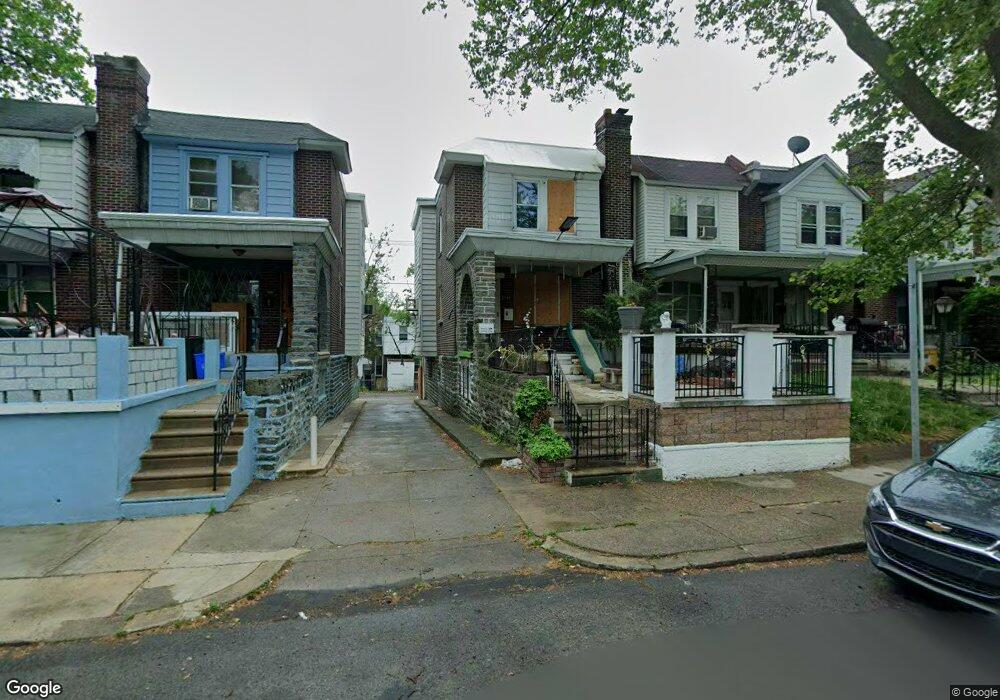
5229 Akron St Philadelphia, PA 19124
Frankford NeighborhoodEstimated Value: $188,000 - $210,423
3
Beds
1
Bath
1,122
Sq Ft
$177/Sq Ft
Est. Value
About This Home
This home is located at 5229 Akron St, Philadelphia, PA 19124 and is currently estimated at $198,106, approximately $176 per square foot. 5229 Akron St is a home located in Philadelphia County with nearby schools including Frankford High School, The Philadelphia Charter School for the Arts & Sciences, and Mastery Schools Smedley Elementary.
Ownership History
Date
Name
Owned For
Owner Type
Purchase Details
Closed on
Jun 30, 2011
Sold by
Harple David J
Bought by
Navia Jesus Beatriz Barreiro
Current Estimated Value
Home Financials for this Owner
Home Financials are based on the most recent Mortgage that was taken out on this home.
Original Mortgage
$63,352
Outstanding Balance
$44,075
Interest Rate
4.75%
Mortgage Type
FHA
Estimated Equity
$154,031
Create a Home Valuation Report for This Property
The Home Valuation Report is an in-depth analysis detailing your home's value as well as a comparison with similar homes in the area
Home Values in the Area
Average Home Value in this Area
Purchase History
| Date | Buyer | Sale Price | Title Company |
|---|---|---|---|
| Navia Jesus Beatriz Barreiro | $65,000 | None Available |
Source: Public Records
Mortgage History
| Date | Status | Borrower | Loan Amount |
|---|---|---|---|
| Open | Navia Jesus Beatriz Barreiro | $63,352 |
Source: Public Records
Tax History Compared to Growth
Tax History
| Year | Tax Paid | Tax Assessment Tax Assessment Total Assessment is a certain percentage of the fair market value that is determined by local assessors to be the total taxable value of land and additions on the property. | Land | Improvement |
|---|---|---|---|---|
| 2025 | $1,930 | $168,600 | $33,720 | $134,880 |
| 2024 | $1,930 | $168,600 | $33,720 | $134,880 |
| 2023 | $1,930 | $137,900 | $27,580 | $110,320 |
| 2022 | $729 | $92,900 | $27,580 | $65,320 |
| 2021 | $1,359 | $0 | $0 | $0 |
| 2020 | $1,359 | $0 | $0 | $0 |
| 2019 | $1,305 | $0 | $0 | $0 |
| 2018 | $1,334 | $0 | $0 | $0 |
| 2017 | $1,334 | $0 | $0 | $0 |
| 2016 | $914 | $0 | $0 | $0 |
| 2015 | $875 | $0 | $0 | $0 |
| 2014 | -- | $95,300 | $19,593 | $75,707 |
| 2012 | -- | $11,936 | $1,287 | $10,649 |
Source: Public Records
Map
Nearby Homes