Estimated Value: $271,575 - $291,000
--
Bed
1
Bath
2,021
Sq Ft
$138/Sq Ft
Est. Value
About This Home
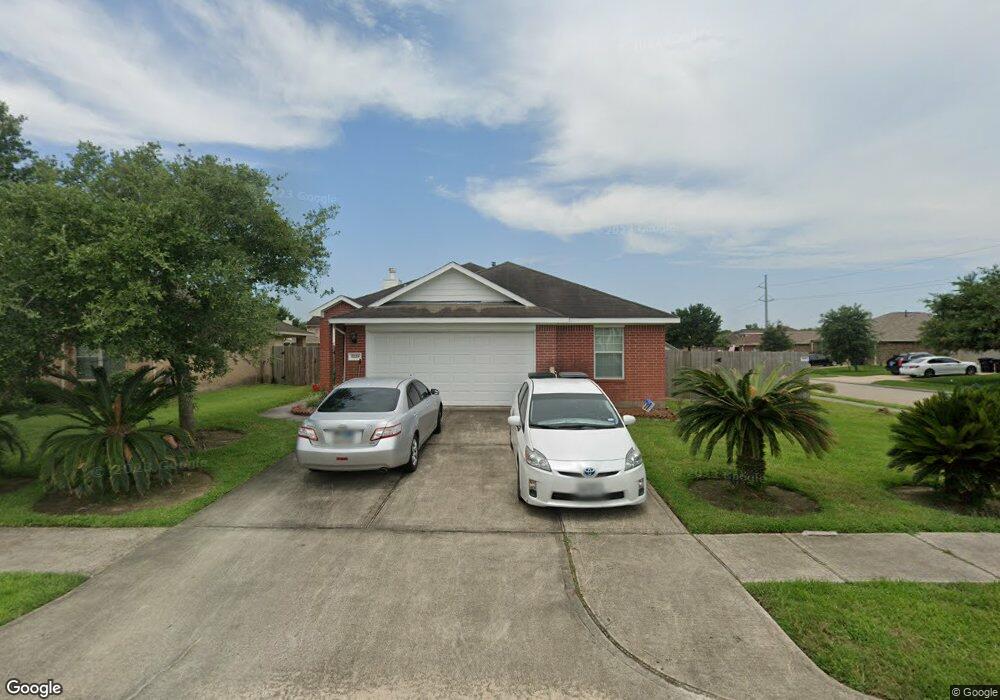
This home is located at 5229 Mcgrath Dr, Alvin, TX 77511 and is currently estimated at $279,144, approximately $138 per square foot. 5229 Mcgrath Dr is a home located in Brazoria County with nearby schools including G.W. Harby Junior High School, Alvin High School, and Living Stones Christian School.
Ownership History
Date
Name
Owned For
Owner Type
Purchase Details
Closed on
Oct 30, 2015
Sold by
Johnson Beulah M and The Ronald B Johnson & Beulah
Bought by
Johnson Beulah M
Current Estimated Value
Purchase Details
Closed on
Jun 8, 2007
Sold by
Black Barry H
Bought by
Choice Homes Inc
Create a Home Valuation Report for This Property
The Home Valuation Report is an in-depth analysis detailing your home's value as well as a comparison with similar homes in the area
Home Values in the Area
Average Home Value in this Area
Purchase History
| Date | Buyer | Sale Price | Title Company |
|---|---|---|---|
| Johnson Beulah M | -- | None Available | |
| Choice Homes Inc | -- | First American Title |
Source: Public Records
Tax History Compared to Growth
Tax History
| Year | Tax Paid | Tax Assessment Tax Assessment Total Assessment is a certain percentage of the fair market value that is determined by local assessors to be the total taxable value of land and additions on the property. | Land | Improvement |
|---|---|---|---|---|
| 2025 | $1,930 | $286,500 | $35,030 | $251,470 |
| 2023 | $1,930 | $242,000 | $35,030 | $244,870 |
| 2022 | $6,034 | $220,000 | $33,630 | $209,800 |
| 2021 | $5,774 | $200,000 | $33,630 | $166,370 |
| 2020 | $5,818 | $198,800 | $33,630 | $165,170 |
| 2019 | $5,527 | $184,000 | $28,020 | $155,980 |
| 2018 | $5,658 | $188,030 | $28,020 | $160,010 |
| 2017 | $5,546 | $182,000 | $23,820 | $158,180 |
| 2016 | $5,122 | $186,940 | $23,820 | $163,120 |
| 2015 | $2,174 | $152,800 | $23,820 | $128,980 |
| 2014 | $2,174 | $139,440 | $23,820 | $115,620 |
Source: Public Records
Map
Nearby Homes
- 394 De Coster Blvd
- 417 De Coster Blvd
- 5690 Highway 35 Bypass
- 875 Barrell Rd
- 5323 Latigo Ct
- 5321 Latigo Ct
- 5330 Latigo Ct
- The Princeton II Plan at Kendall Lakes
- The Crawford Plan at Kendall Lakes
- The Davenport II Plan at Kendall Lakes
- The Georgetown II Plan at Kendall Lakes
- The Pearson Plan at Kendall Lakes
- The James Plan at Kendall Lakes
- The McGinnis Plan at Kendall Lakes
- 5318 Latigo Ct
- Madison Plan at Kendall Lakes
- Avery Plan at Kendall Lakes
- Elias Plan at Skyview
- Christina Plan at Kendall Lakes
- Rev Plan at Skyview
- 5227 Mcgrath Dr
- 5225 Mcgrath Dr
- 397 De Coster Blvd
- 392 De Coster Blvd
- 406 De Coster Blvd
- 393 Hannah Ln
- 5223 Mcgrath Dr
- 5220 Everts Ave
- 399 De Coster Blvd
- 401 Decoster Blvd
- 390 De Coster Blvd
- 395 De Coster Blvd
- 5226 Mcgrath Dr
- 403 De Coster Blvd
- 408 De Coster Blvd
- 5221 Mcgrath Dr
- 393 De Coster Blvd
- 407 De Coster Blvd
- 391 Hannah Ln
- 5224 Mcgrath Dr