Estimated Value: $150,754 - $489,000
2
Beds
1
Bath
1,332
Sq Ft
$190/Sq Ft
Est. Value
About This Home
This home is located at 523 Bond Rd, Cairo, GA 39827 and is currently estimated at $253,439, approximately $190 per square foot. 523 Bond Rd is a home located in Grady County.
Ownership History
Date
Name
Owned For
Owner Type
Purchase Details
Closed on
May 1, 2007
Sold by
Ponder Frank
Bought by
Allen Christopher B and Allen Sandra M
Current Estimated Value
Home Financials for this Owner
Home Financials are based on the most recent Mortgage that was taken out on this home.
Original Mortgage
$91,500
Outstanding Balance
$53,848
Interest Rate
6.12%
Mortgage Type
New Conventional
Estimated Equity
$199,591
Purchase Details
Closed on
Mar 9, 2007
Sold by
Bank Of America
Bought by
Ponder Frank
Home Financials for this Owner
Home Financials are based on the most recent Mortgage that was taken out on this home.
Original Mortgage
$91,500
Outstanding Balance
$53,848
Interest Rate
6.12%
Mortgage Type
New Conventional
Estimated Equity
$199,591
Purchase Details
Closed on
Dec 18, 2006
Sold by
Rentz Charles W
Bought by
Bank Of America Na
Purchase Details
Closed on
May 28, 1999
Sold by
Thomas Robbie
Bought by
Rentz Charles W
Purchase Details
Closed on
May 26, 1992
Bought by
Thomas Robbie
Create a Home Valuation Report for This Property
The Home Valuation Report is an in-depth analysis detailing your home's value as well as a comparison with similar homes in the area
Purchase History
| Date | Buyer | Sale Price | Title Company |
|---|---|---|---|
| Allen Christopher B | $91,500 | -- | |
| Ponder Frank | $57,500 | -- | |
| Bank Of America Na | $48,000 | -- | |
| Rentz Charles W | $48,000 | -- | |
| Thomas Robbie | $24,000 | -- |
Source: Public Records
Mortgage History
| Date | Status | Borrower | Loan Amount |
|---|---|---|---|
| Open | Allen Christopher B | $91,500 |
Source: Public Records
Tax History
| Year | Tax Paid | Tax Assessment Tax Assessment Total Assessment is a certain percentage of the fair market value that is determined by local assessors to be the total taxable value of land and additions on the property. | Land | Improvement |
|---|---|---|---|---|
| 2025 | $1,222 | $50,018 | $2,400 | $47,618 |
| 2024 | $1,222 | $44,792 | $2,400 | $42,392 |
| 2023 | $1,155 | $39,526 | $2,280 | $37,246 |
| 2022 | $1,155 | $39,526 | $2,280 | $37,246 |
| 2021 | $1,162 | $39,632 | $2,280 | $37,352 |
| 2020 | $1,166 | $39,632 | $2,280 | $37,352 |
| 2019 | $1,166 | $39,632 | $2,280 | $37,352 |
| 2018 | $1,095 | $39,632 | $2,280 | $37,352 |
| 2017 | $1,042 | $39,632 | $2,280 | $37,352 |
| 2016 | $878 | $33,535 | $2,280 | $31,255 |
| 2015 | $868 | $33,535 | $2,280 | $31,255 |
| 2014 | $869 | $33,535 | $2,280 | $31,255 |
| 2013 | -- | $28,508 | $2,520 | $25,988 |
Source: Public Records
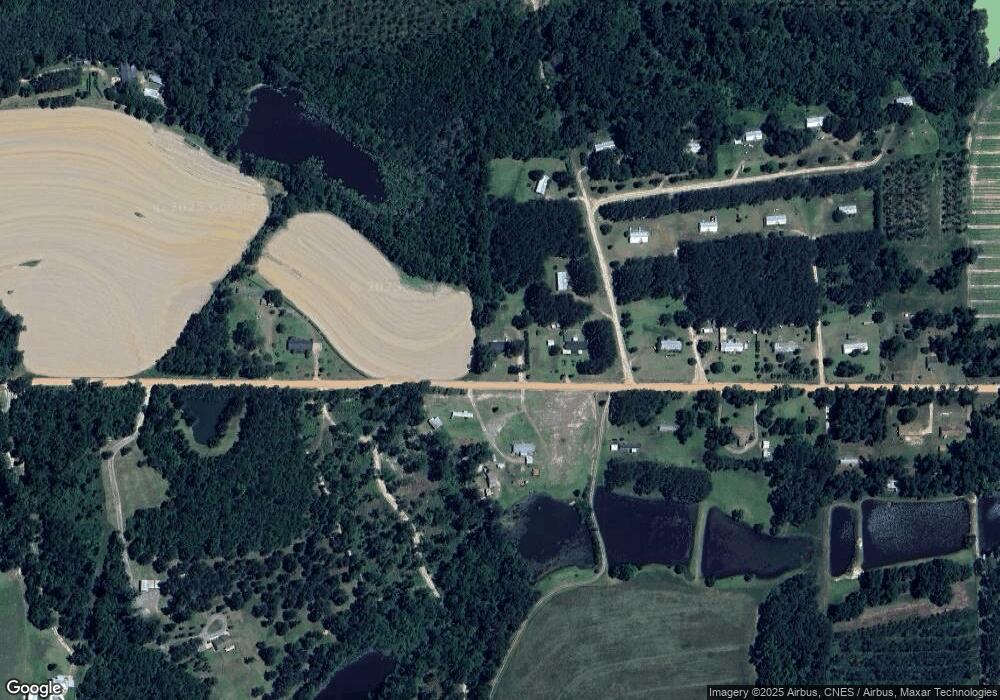
Map
Nearby Homes
Your Personal Tour Guide
Ask me questions while you tour the home.