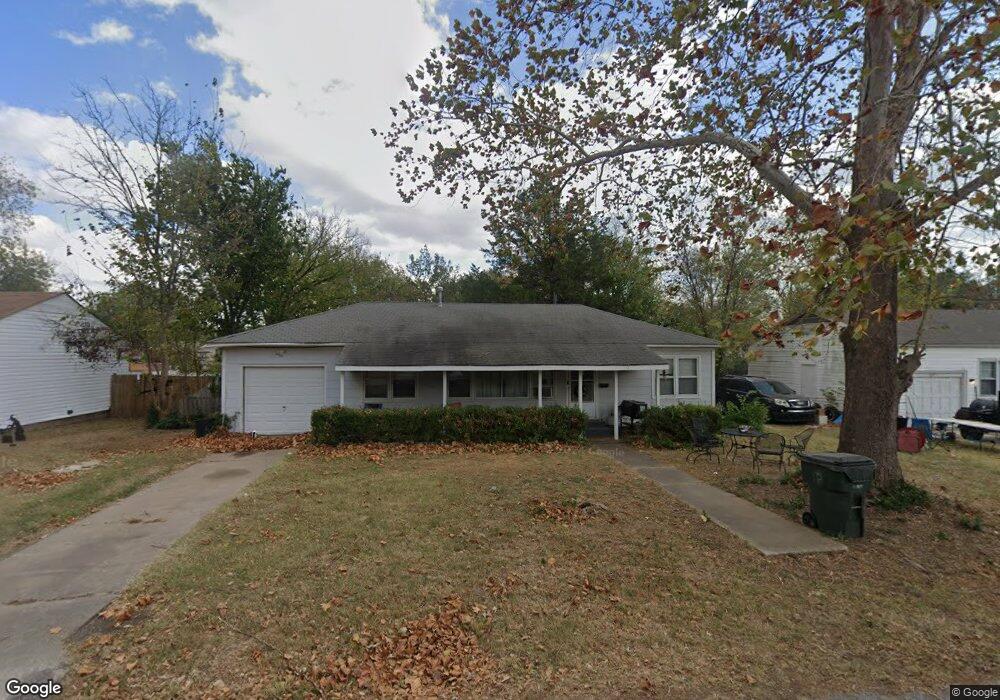
523 Cedar Ln Okmulgee, OK 74447
Estimated Value: $78,919 - $126,000
2
Beds
1
Bath
1,248
Sq Ft
$77/Sq Ft
Est. Value
About This Home
This home is located at 523 Cedar Ln, Okmulgee, OK 74447 and is currently estimated at $96,230, approximately $77 per square foot. 523 Cedar Ln is a home located in Okmulgee County with nearby schools including Okmulgee Primary School, Dunbar Elementary School, and Okmulgee Middle School.
Ownership History
Date
Name
Owned For
Owner Type
Purchase Details
Closed on
Jul 12, 2005
Sold by
Sallee Charles H and Sallee Patsy R
Bought by
White David L and White Jacqualine
Current Estimated Value
Home Financials for this Owner
Home Financials are based on the most recent Mortgage that was taken out on this home.
Original Mortgage
$6,500
Interest Rate
6.05%
Mortgage Type
Purchase Money Mortgage
Purchase Details
Closed on
Sep 6, 1995
Sold by
Sallee Charles and Sallee Patsy
Bought by
White David and White Drew J
Create a Home Valuation Report for This Property
The Home Valuation Report is an in-depth analysis detailing your home's value as well as a comparison with similar homes in the area
Home Values in the Area
Average Home Value in this Area
Purchase History
| Date | Buyer | Sale Price | Title Company |
|---|---|---|---|
| White David L | $3,500 | Oklahoma Title & Escrow Corp | |
| White David | $28,000 | -- |
Source: Public Records
Mortgage History
| Date | Status | Borrower | Loan Amount |
|---|---|---|---|
| Closed | White David L | $6,500 |
Source: Public Records
Tax History Compared to Growth
Tax History
| Year | Tax Paid | Tax Assessment Tax Assessment Total Assessment is a certain percentage of the fair market value that is determined by local assessors to be the total taxable value of land and additions on the property. | Land | Improvement |
|---|---|---|---|---|
| 2025 | $442 | $5,125 | $540 | $4,585 |
| 2024 | $442 | $5,086 | $540 | $4,546 |
| 2023 | $403 | $4,648 | $540 | $4,108 |
| 2022 | $374 | $4,427 | $540 | $3,887 |
| 2021 | $373 | $4,427 | $540 | $3,887 |
| 2020 | $355 | $4,016 | $540 | $3,476 |
| 2019 | $338 | $3,825 | $540 | $3,285 |
| 2018 | $326 | $3,642 | $540 | $3,102 |
| 2017 | $307 | $3,469 | $540 | $2,929 |
| 2016 | $293 | $3,304 | $540 | $2,764 |
| 2015 | $271 | $3,147 | $540 | $2,607 |
| 2014 | $260 | $2,997 | $540 | $2,457 |
Source: Public Records
Map
Nearby Homes