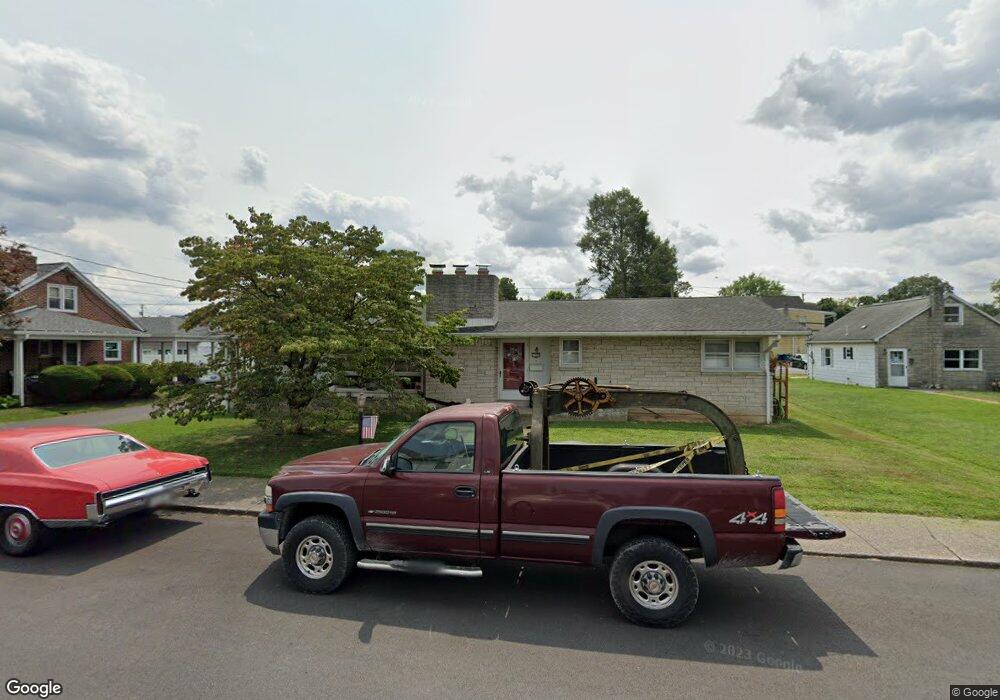
523 Eshelman St Highspire, PA 17034
Estimated Value: $224,000 - $256,993
2
Beds
2
Baths
1,662
Sq Ft
$146/Sq Ft
Est. Value
About This Home
This home is located at 523 Eshelman St, Highspire, PA 17034 and is currently estimated at $242,248, approximately $145 per square foot. 523 Eshelman St is a home located in Dauphin County with nearby schools including Steelton-Highspire El School, Steelton-Highspire High School, and Seven Sorrows of BVM School.
Ownership History
Date
Name
Owned For
Owner Type
Purchase Details
Closed on
Feb 10, 2021
Sold by
Burns Richard C
Bought by
Burns Richard C and Wagner Amy E
Current Estimated Value
Purchase Details
Closed on
Apr 21, 2004
Sold by
Gross Robert
Bought by
Burns Richard
Home Financials for this Owner
Home Financials are based on the most recent Mortgage that was taken out on this home.
Original Mortgage
$94,400
Outstanding Balance
$43,616
Interest Rate
5.4%
Mortgage Type
New Conventional
Estimated Equity
$198,632
Create a Home Valuation Report for This Property
The Home Valuation Report is an in-depth analysis detailing your home's value as well as a comparison with similar homes in the area
Home Values in the Area
Average Home Value in this Area
Purchase History
| Date | Buyer | Sale Price | Title Company |
|---|---|---|---|
| Burns Richard C | -- | Hershey Abstract Setmnt Svcs | |
| Burns Richard | $120,000 | -- |
Source: Public Records
Mortgage History
| Date | Status | Borrower | Loan Amount |
|---|---|---|---|
| Open | Burns Richard | $94,400 |
Source: Public Records
Tax History Compared to Growth
Tax History
| Year | Tax Paid | Tax Assessment Tax Assessment Total Assessment is a certain percentage of the fair market value that is determined by local assessors to be the total taxable value of land and additions on the property. | Land | Improvement |
|---|---|---|---|---|
| 2025 | $5,568 | $98,200 | $17,800 | $80,400 |
| 2024 | $5,274 | $98,200 | $17,800 | $80,400 |
| 2023 | $5,274 | $98,200 | $17,800 | $80,400 |
| 2022 | $5,274 | $98,200 | $17,800 | $80,400 |
| 2021 | $5,274 | $98,200 | $17,800 | $80,400 |
| 2020 | $5,274 | $98,200 | $17,800 | $80,400 |
| 2019 | $5,225 | $98,200 | $17,800 | $80,400 |
| 2018 | $5,834 | $112,300 | $17,800 | $94,500 |
| 2017 | $5,834 | $112,300 | $17,800 | $94,500 |
| 2016 | $0 | $112,300 | $17,800 | $94,500 |
| 2015 | -- | $112,300 | $17,800 | $94,500 |
| 2014 | -- | $112,300 | $17,800 | $94,500 |
Source: Public Records
Map
Nearby Homes