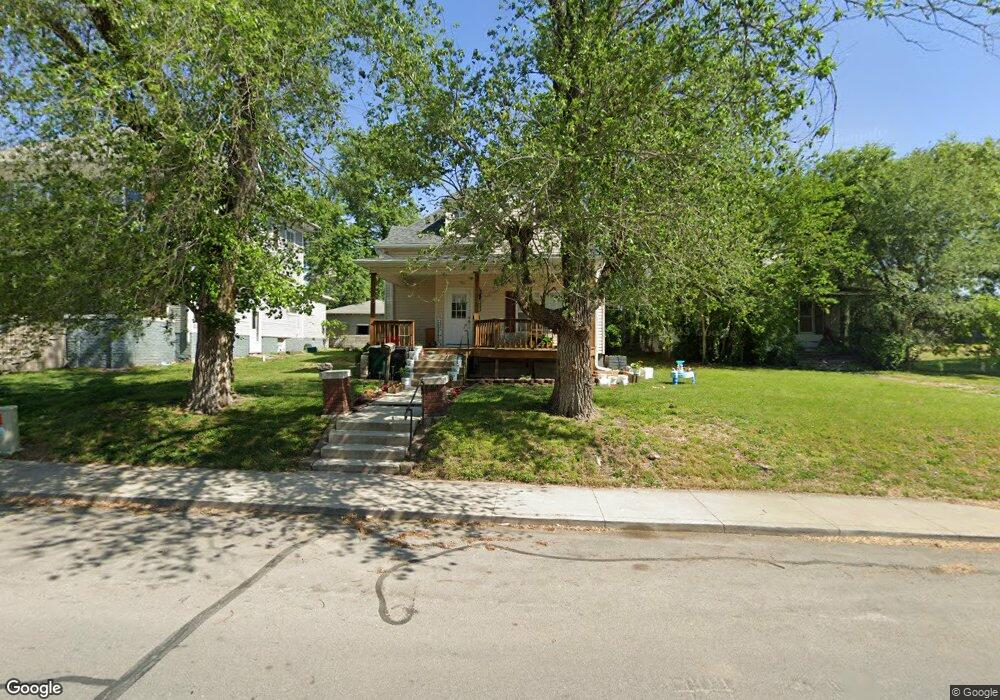
523 Fisk Ave Moberly, MO 65270
Estimated Value: $106,000 - $133,862
2
Beds
1
Bath
1,393
Sq Ft
$86/Sq Ft
Est. Value
About This Home
This home is located at 523 Fisk Ave, Moberly, MO 65270 and is currently estimated at $119,466, approximately $85 per square foot. 523 Fisk Ave is a home located in Randolph County with nearby schools including Moberly Senior High School, St. Pius X. Catholic School, and Maranatha Seventh-day Adventist School.
Ownership History
Date
Name
Owned For
Owner Type
Purchase Details
Closed on
Dec 24, 2012
Sold by
Grfms Trustee Services 1 Inc
Bought by
Federal Home Loan Mortgage Corp
Current Estimated Value
Purchase Details
Closed on
Mar 21, 2011
Sold by
Holloway Jacob S
Bought by
Ratliff Angela R
Home Financials for this Owner
Home Financials are based on the most recent Mortgage that was taken out on this home.
Original Mortgage
$56,891
Interest Rate
5.04%
Purchase Details
Closed on
Mar 12, 2010
Sold by
Hsbc Bank Usa Na
Bought by
Holloway Jacob S
Home Financials for this Owner
Home Financials are based on the most recent Mortgage that was taken out on this home.
Original Mortgage
$36,000
Interest Rate
4.93%
Mortgage Type
Future Advance Clause Open End Mortgage
Create a Home Valuation Report for This Property
The Home Valuation Report is an in-depth analysis detailing your home's value as well as a comparison with similar homes in the area
Home Values in the Area
Average Home Value in this Area
Purchase History
| Date | Buyer | Sale Price | Title Company |
|---|---|---|---|
| Federal Home Loan Mortgage Corp | $46,737 | -- | |
| Ratliff Angela R | -- | -- | |
| Holloway Jacob S | -- | -- |
Source: Public Records
Mortgage History
| Date | Status | Borrower | Loan Amount |
|---|---|---|---|
| Previous Owner | Ratliff Angela R | $56,891 | |
| Previous Owner | Holloway Jacob S | $36,000 |
Source: Public Records
Tax History
| Year | Tax Paid | Tax Assessment Tax Assessment Total Assessment is a certain percentage of the fair market value that is determined by local assessors to be the total taxable value of land and additions on the property. | Land | Improvement |
|---|---|---|---|---|
| 2025 | $684 | $10,070 | $982 | $9,088 |
| 2024 | $7 | $9,390 | $855 | $8,535 |
| 2023 | $694 | $9,390 | $855 | $8,535 |
| 2022 | $653 | $9,070 | $855 | $8,215 |
| 2020 | $653 | $9,070 | $855 | $8,215 |
| 2019 | $651 | $9,070 | $855 | $8,215 |
| 2018 | $646 | $9,030 | $855 | $8,175 |
| 2017 | $652 | $9,120 | $0 | $0 |
| 2016 | $625 | $8,790 | $0 | $0 |
| 2014 | -- | $10,260 | $0 | $0 |
| 2013 | -- | $10,260 | $0 | $0 |
| 2012 | -- | $10,260 | $0 | $0 |
Source: Public Records
Map
Nearby Homes
- 216 S 5th St
- 309 S 4th St
- 311 Epperson St
- 632 W Logan St
- 419 S 4th St
- 710 W Rollins St
- 508 S Williams St
- LOT 2 County Rd
- 816 W Reed St
- 612 S 4th St
- 709 Gilman St
- 707 S 5th St
- 101 N Ault St
- 953 W Rollins St
- 1004 W Reed St
- 4 Fair Oaks
- 812 N Moulton St
- 501 W Longview St
- 409 Barrow St
- 1000 S Williams St