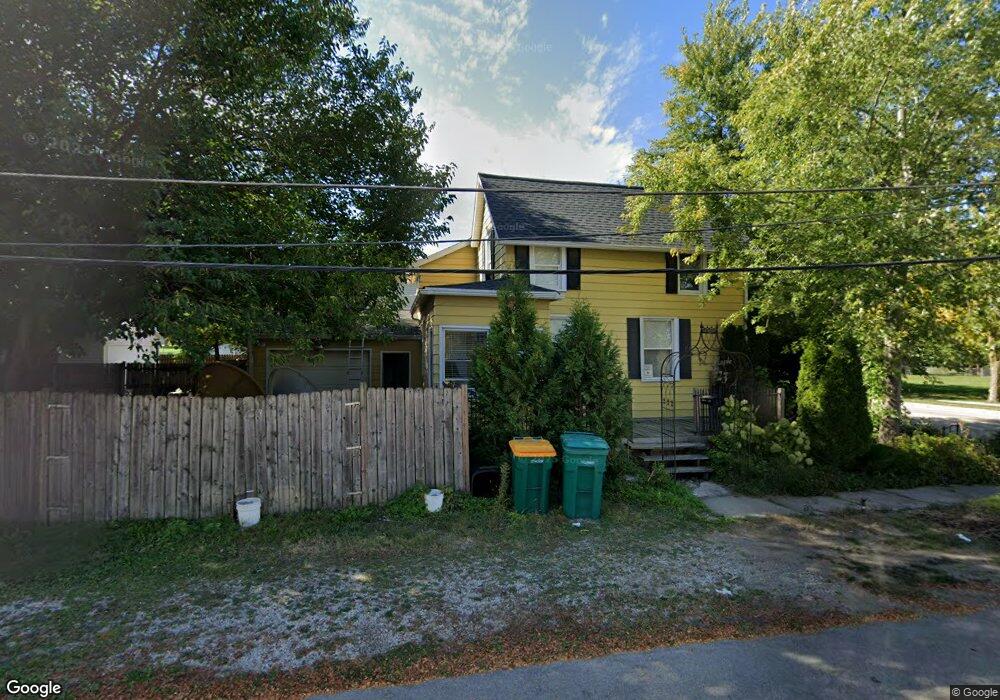
523 N Maple St Sycamore, IL 60178
Estimated Value: $189,000 - $220,000
3
Beds
6
Baths
1,400
Sq Ft
$150/Sq Ft
Est. Value
About This Home
This home is located at 523 N Maple St, Sycamore, IL 60178 and is currently estimated at $209,753, approximately $149 per square foot. 523 N Maple St is a home located in DeKalb County with nearby schools including Sycamore High School, Cornerstone Christian Academy, and St Mary's Catholic School.
Ownership History
Date
Name
Owned For
Owner Type
Purchase Details
Closed on
Dec 27, 2005
Sold by
Enoch Matthew
Bought by
Tennant Jacob and Benson Tennant Bree S
Current Estimated Value
Home Financials for this Owner
Home Financials are based on the most recent Mortgage that was taken out on this home.
Original Mortgage
$112,000
Outstanding Balance
$63,732
Interest Rate
6.48%
Mortgage Type
New Conventional
Estimated Equity
$146,021
Purchase Details
Closed on
Jul 27, 2005
Sold by
Dawn Victoria L
Bought by
Enoch Matthew
Create a Home Valuation Report for This Property
The Home Valuation Report is an in-depth analysis detailing your home's value as well as a comparison with similar homes in the area
Home Values in the Area
Average Home Value in this Area
Purchase History
| Date | Buyer | Sale Price | Title Company |
|---|---|---|---|
| Tennant Jacob | $139,000 | -- | |
| Enoch Matthew | $90,000 | -- |
Source: Public Records
Mortgage History
| Date | Status | Borrower | Loan Amount |
|---|---|---|---|
| Open | Tennant Jacob | $112,000 |
Source: Public Records
Tax History
| Year | Tax Paid | Tax Assessment Tax Assessment Total Assessment is a certain percentage of the fair market value that is determined by local assessors to be the total taxable value of land and additions on the property. | Land | Improvement |
|---|---|---|---|---|
| 2024 | $4,591 | $55,573 | $6,423 | $49,150 |
| 2023 | $4,411 | $50,747 | $5,865 | $44,882 |
| 2022 | $4,411 | $46,544 | $5,379 | $41,165 |
| 2021 | $4,216 | $43,695 | $5,050 | $38,645 |
| 2020 | $4,164 | $42,621 | $4,926 | $37,695 |
| 2019 | $3,512 | $41,687 | $4,818 | $36,869 |
| 2018 | $3,442 | $40,422 | $4,672 | $35,750 |
| 2017 | $3,343 | $38,822 | $4,487 | $34,335 |
| 2016 | $3,246 | $37,051 | $4,282 | $32,769 |
| 2015 | -- | $34,871 | $4,030 | $30,841 |
| 2014 | -- | $33,113 | $3,827 | $29,286 |
| 2013 | -- | $33,747 | $3,900 | $29,847 |
Source: Public Records
Map
Nearby Homes
- 315 North Ave
- 335 North Ave
- 1929 Galloway Ct
- 45 Briden Ln Unit 45
- Lot 1 Route 23
- 533 W State St
- 149 Penny Ln
- 52 Kloe Ln Unit 52
- 60 Kloe Ln Unit 60
- 405 W High St
- 941 Arvle Cir
- 64 Kloe Ln Unit 64
- 1102 Oxford Cir
- 1193 Rose Dr
- 356 Home St
- 401 E Lincoln St
- 700 Susan St
- 163 Mclaren Dr N Unit 6F
- 326 Edward St
- 835 Albert Ave
Your Personal Tour Guide
Ask me questions while you tour the home.