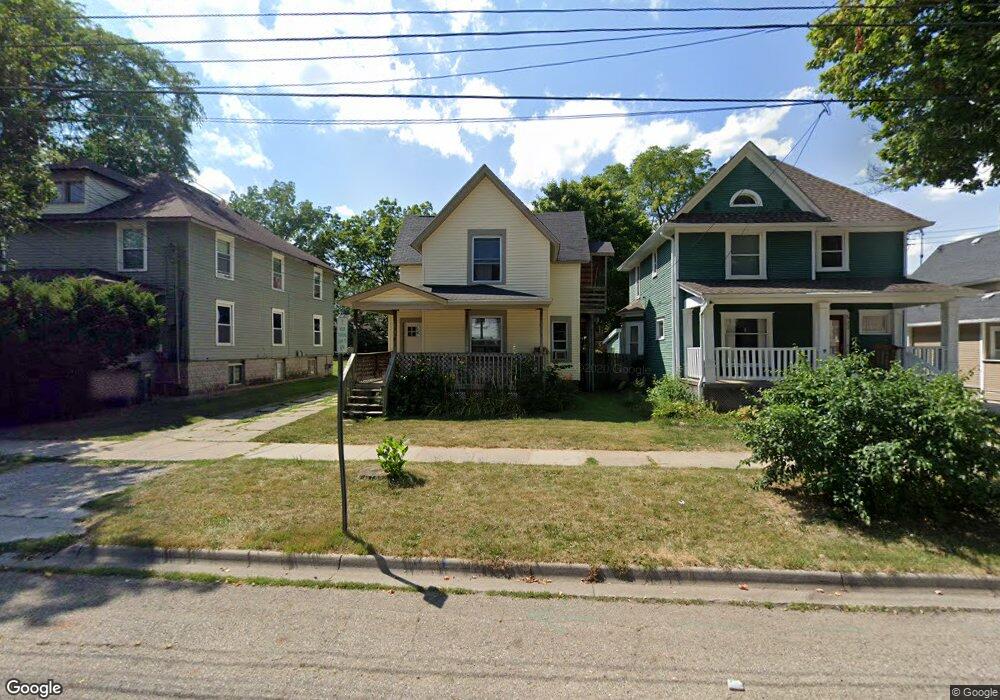
523 N Sycamore St Unit 1 Lansing, MI 48933
Downtown Lansing NeighborhoodEstimated Value: $110,000 - $181,000
--
Bed
1
Bath
1,652
Sq Ft
$88/Sq Ft
Est. Value
About This Home
This home is located at 523 N Sycamore St Unit 1, Lansing, MI 48933 and is currently estimated at $145,630, approximately $88 per square foot. 523 N Sycamore St Unit 1 is a home located in Ingham County with nearby schools including Riddle Elementary School, Pattengill Academy, and J.W. Sexton High School.
Ownership History
Date
Name
Owned For
Owner Type
Purchase Details
Closed on
Jul 1, 2021
Sold by
Brueggeman Michael
Bought by
Olivarez Marcelo and Olivarez Amy G
Current Estimated Value
Purchase Details
Closed on
Jan 24, 2007
Sold by
Pnc Equities I Llc
Bought by
Brueggeman Michael J
Purchase Details
Closed on
Jun 18, 2004
Sold by
Watkins Duwayne H
Bought by
Pnc Equities I Llc
Home Financials for this Owner
Home Financials are based on the most recent Mortgage that was taken out on this home.
Original Mortgage
$221,531
Interest Rate
9.5%
Mortgage Type
Seller Take Back
Purchase Details
Closed on
Apr 16, 2004
Sold by
Brueggeman Michael and Brueggeman Gabriela
Bought by
Pnc Equities I Llc
Purchase Details
Closed on
Dec 31, 1997
Sold by
Watkins Duwayne
Bought by
Brueggeman Michael
Create a Home Valuation Report for This Property
The Home Valuation Report is an in-depth analysis detailing your home's value as well as a comparison with similar homes in the area
Home Values in the Area
Average Home Value in this Area
Purchase History
| Date | Buyer | Sale Price | Title Company |
|---|---|---|---|
| Olivarez Marcelo | $60,000 | Ata National Title Group Llc | |
| Brueggeman Michael J | -- | None Available | |
| Pnc Equities I Llc | $300,000 | Metropolitan Title Okemos | |
| Pnc Equities I Llc | -- | Metropolitan Title Okemos | |
| Brueggeman Michael | $600,000 | -- | |
| Pnc Equities I L L C | $300,000 | -- |
Source: Public Records
Mortgage History
| Date | Status | Borrower | Loan Amount |
|---|---|---|---|
| Previous Owner | Pnc Equities I Llc | $221,531 |
Source: Public Records
Tax History Compared to Growth
Tax History
| Year | Tax Paid | Tax Assessment Tax Assessment Total Assessment is a certain percentage of the fair market value that is determined by local assessors to be the total taxable value of land and additions on the property. | Land | Improvement |
|---|---|---|---|---|
| 2025 | $4,769 | $65,500 | $6,200 | $59,300 |
| 2024 | $39 | $62,200 | $6,200 | $56,000 |
| 2023 | $4,490 | $56,100 | $6,200 | $49,900 |
| 2022 | $4,178 | $50,700 | $6,800 | $43,900 |
| 2021 | $2,109 | $49,100 | $8,600 | $40,500 |
| 2020 | $2,093 | $46,500 | $8,600 | $37,900 |
| 2019 | $2,015 | $42,400 | $8,600 | $33,800 |
| 2018 | $1,917 | $40,500 | $8,600 | $31,900 |
| 2017 | $1,842 | $40,500 | $8,600 | $31,900 |
| 2016 | $1,769 | $39,800 | $8,600 | $31,200 |
| 2015 | $1,769 | $38,800 | $17,273 | $21,527 |
| 2014 | $1,769 | $36,800 | $19,500 | $17,300 |
Source: Public Records
Map
Nearby Homes
- 423 N Pine St
- 732 W Lapeer St
- 325 N Sycamore St
- 611 N Pine St
- 433 N Butler Blvd
- 425/425.5 N Butler Blvd
- 427 N Butler Blvd
- 531 N Butler Blvd
- 612 N Pine St
- 312 N Butler Blvd
- 1017 W Genesee St
- 509 N Walnut St Unit 1
- 422 N Martin Luther King Junior Blvd
- 418 N Martin Luther King Junior Blvd
- 416 N Martin Luther King Junior Blvd
- 705 Princeton Ave
- 751 Chicago Ave
- 411 W Ionia St
- 309 W Lapeer St
- 754 Princeton Ave
- 527 N Sycamore St
- 517 N Sycamore St
- 529 N Sycamore St
- 711 W Lapeer St
- 709 W Lapeer St
- 511 N Sycamore St
- 713 W Lapeer St
- 535 N Sycamore St
- 520 Leitram St
- 516 Leitram St
- 524 Leitram St Unit 1
- 514 Leitram St
- 528 Leitram St Unit 1
- 507 N Sycamore St
- 507 N Sycamore St Unit 2nd Floor
- 507 N Sycamore St Unit 1st Floor
- 510 Leitram St
- 708 W Genesee St
- 501 N Sycamore St
- 712 W Genesee St