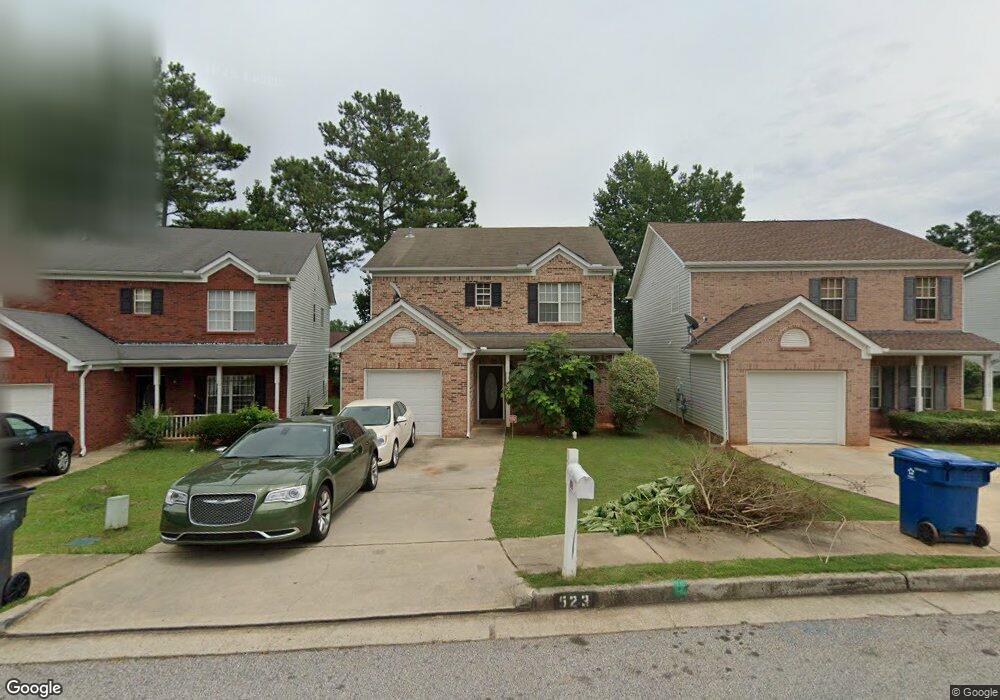
523 Shadowmoore Dr Riverdale, GA 30274
Estimated Value: $228,007 - $279,000
3
Beds
3
Baths
1,758
Sq Ft
$144/Sq Ft
Est. Value
About This Home
This home is located at 523 Shadowmoore Dr, Riverdale, GA 30274 and is currently estimated at $252,752, approximately $143 per square foot. 523 Shadowmoore Dr is a home located in Clayton County with nearby schools including Church Street Elementary School, Riverdale Middle School, and Riverdale High School.
Ownership History
Date
Name
Owned For
Owner Type
Purchase Details
Closed on
Feb 13, 2012
Sold by
Secretary Of Housing And U
Bought by
Nguyen Trin Thu
Current Estimated Value
Purchase Details
Closed on
Apr 20, 2011
Sold by
Joiner Alisa
Bought by
Moore Eva
Purchase Details
Closed on
Oct 15, 2007
Sold by
Randall Adrienne C
Bought by
Joiner Alisa and Hudgeon Jonathan
Home Financials for this Owner
Home Financials are based on the most recent Mortgage that was taken out on this home.
Original Mortgage
$132,914
Interest Rate
6.44%
Mortgage Type
New Conventional
Purchase Details
Closed on
Apr 9, 2003
Sold by
Arbor Const Inc
Bought by
Randall Adrienne C
Home Financials for this Owner
Home Financials are based on the most recent Mortgage that was taken out on this home.
Original Mortgage
$129,275
Interest Rate
5.86%
Mortgage Type
New Conventional
Create a Home Valuation Report for This Property
The Home Valuation Report is an in-depth analysis detailing your home's value as well as a comparison with similar homes in the area
Home Values in the Area
Average Home Value in this Area
Purchase History
| Date | Buyer | Sale Price | Title Company |
|---|---|---|---|
| Nguyen Trin Thu | $39,000 | -- | |
| Moore Eva | -- | -- | |
| Joiner Alisa | $135,000 | -- | |
| Randall Adrienne C | $129,300 | -- |
Source: Public Records
Mortgage History
| Date | Status | Borrower | Loan Amount |
|---|---|---|---|
| Previous Owner | Joiner Alisa | $132,914 | |
| Previous Owner | Randall Adrienne C | $129,275 |
Source: Public Records
Tax History Compared to Growth
Tax History
| Year | Tax Paid | Tax Assessment Tax Assessment Total Assessment is a certain percentage of the fair market value that is determined by local assessors to be the total taxable value of land and additions on the property. | Land | Improvement |
|---|---|---|---|---|
| 2024 | $2,977 | $76,320 | $9,600 | $66,720 |
| 2023 | $2,440 | $76,360 | $9,600 | $66,760 |
| 2022 | $2,488 | $72,120 | $9,600 | $62,520 |
| 2021 | $1,848 | $53,200 | $9,600 | $43,600 |
| 2020 | $1,757 | $50,063 | $9,600 | $40,463 |
| 2019 | $1,726 | $48,486 | $9,600 | $38,886 |
| 2018 | $1,425 | $40,042 | $9,600 | $30,442 |
| 2017 | $606 | $35,993 | $9,600 | $26,393 |
| 2016 | $1,217 | $34,108 | $9,600 | $24,508 |
| 2015 | $1,203 | $0 | $0 | $0 |
| 2014 | $1,321 | $37,983 | $9,600 | $28,383 |
Source: Public Records
Map
Nearby Homes
- 623 Shadowmoore Dr
- 7563 Winderemere Park
- 510 Olde Rose Ct Unit 1
- 462 Paul St
- 7584 Ann St
- 7560 Taylor Rd Unit 5
- 785 Commerce Blvd
- 326 Highway 138 SW
- 828 Commerce Blvd
- 838 Cormac Dr
- 7555 Howell Ln
- 7190 Williamsburg Dr
- 828 Crescent Dr Unit 62
- 830 Crescent Dr Unit 61
- 8630 WEBB Rd
- 36 Highway 138 SW
- 245 Antebellum Cir
- 7157 Williamsburg Dr
- 7086 Williamsburg Dr
- 7899 Taylor Downs Way
- 519 Shadowmoore Dr
- 527 Shadowmoore Dr
- 531 Shadowmoore Dr
- 7570 Larchwood Ln
- 7566 Larchwood Ln
- 7557 Coddington Ct Unit 1
- 7549 Coddington Ct
- 535 Shadowmoore Dr
- 7565 Coddington Ct Unit 1
- 530 Shadowmoore Dr
- 539 Shadowmoore Dr
- 526 Shadowmoore Dr
- 7541 Coddington Ct
- 7574 Larchwood Ln
- 534 Shadowmoore Dr
- 522 Shadowmoore Dr
- 0 Larchwood Ln Unit 7240050
- 0 Larchwood Ln Unit 7043528
- 0 Shadowmoore Dr Unit 7323010
- 0 Larchwood Ln Unit 3233636