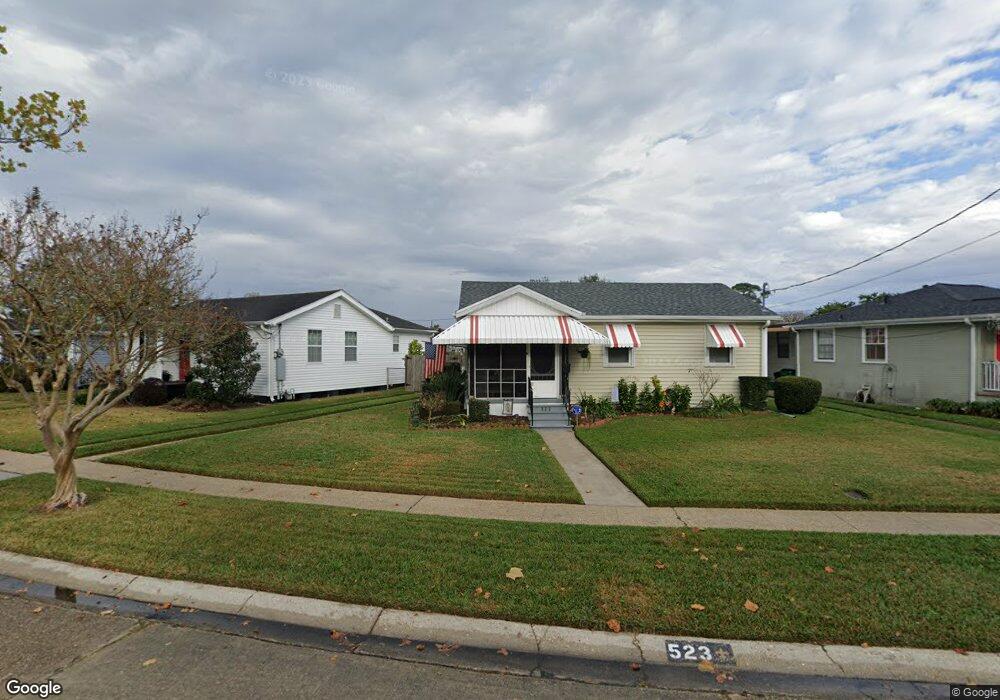
523 Tucker Ave Jefferson, LA 70121
Estimated Value: $239,000 - $268,000
3
Beds
1
Bath
1,142
Sq Ft
$219/Sq Ft
Est. Value
About This Home
This home is located at 523 Tucker Ave, Jefferson, LA 70121 and is currently estimated at $249,733, approximately $218 per square foot. 523 Tucker Ave is a home located in Jefferson Parish with nearby schools including Jefferson Elementary School, Metairie Academy For Advanced Studies, and Riverdale High School.
Ownership History
Date
Name
Owned For
Owner Type
Purchase Details
Closed on
Dec 23, 2010
Sold by
Bryant James E
Bought by
Sciarrotta Vincent
Current Estimated Value
Home Financials for this Owner
Home Financials are based on the most recent Mortgage that was taken out on this home.
Original Mortgage
$166,155
Outstanding Balance
$110,832
Interest Rate
4.41%
Mortgage Type
New Conventional
Estimated Equity
$138,901
Purchase Details
Closed on
Jul 28, 2010
Sold by
Fruge Steven K
Bought by
Bryant Sandra J
Create a Home Valuation Report for This Property
The Home Valuation Report is an in-depth analysis detailing your home's value as well as a comparison with similar homes in the area
Home Values in the Area
Average Home Value in this Area
Purchase History
| Date | Buyer | Sale Price | Title Company |
|---|---|---|---|
| Sciarrotta Vincent | $174,900 | -- | |
| Bryant Sandra J | $78,000 | -- | |
| Fruge Michelle R | $65,000 | -- |
Source: Public Records
Mortgage History
| Date | Status | Borrower | Loan Amount |
|---|---|---|---|
| Open | Sciarrotta Vincent | $166,155 |
Source: Public Records
Tax History Compared to Growth
Tax History
| Year | Tax Paid | Tax Assessment Tax Assessment Total Assessment is a certain percentage of the fair market value that is determined by local assessors to be the total taxable value of land and additions on the property. | Land | Improvement |
|---|---|---|---|---|
| 2024 | $2,632 | $18,010 | $2,870 | $15,140 |
| 2023 | $1,383 | $18,010 | $2,870 | $15,140 |
| 2022 | $2,307 | $18,010 | $2,870 | $15,140 |
| 2021 | $2,143 | $18,010 | $2,870 | $15,140 |
| 2020 | $2,128 | $18,010 | $2,870 | $15,140 |
| 2019 | $2,187 | $18,010 | $2,640 | $15,370 |
| 2018 | $1,192 | $18,010 | $2,640 | $15,370 |
| 2017 | $2,042 | $18,010 | $2,640 | $15,370 |
| 2016 | $2,003 | $18,010 | $2,640 | $15,370 |
| 2015 | $1,124 | $17,490 | $2,640 | $14,850 |
| 2014 | $1,124 | $17,490 | $2,640 | $14,850 |
Source: Public Records
Map
Nearby Homes