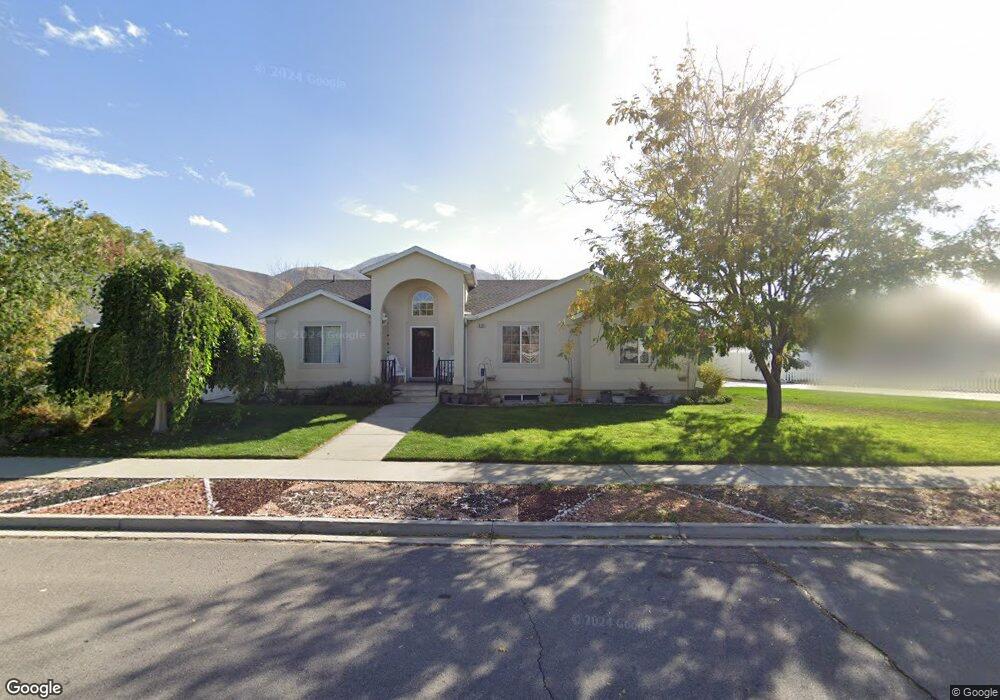
523 W 1240 S Payson, UT 84651
Estimated Value: $551,000 - $585,000
3
Beds
2
Baths
1,743
Sq Ft
$326/Sq Ft
Est. Value
About This Home
This home is located at 523 W 1240 S, Payson, UT 84651 and is currently estimated at $567,783, approximately $325 per square foot. 523 W 1240 S is a home located in Utah County with nearby schools including Spring Lake Elementary, Payson Junior High School, and Payson High School.
Ownership History
Date
Name
Owned For
Owner Type
Purchase Details
Closed on
Mar 5, 2021
Sold by
Little Cory and Little Jennifer
Bought by
Little Cory and Little Jennifer
Current Estimated Value
Purchase Details
Closed on
Jan 21, 2011
Sold by
Little Cory S and Little Jennifer
Bought by
Little Cory and Little Jennifer
Home Financials for this Owner
Home Financials are based on the most recent Mortgage that was taken out on this home.
Original Mortgage
$180,000
Outstanding Balance
$5,570
Interest Rate
4.82%
Mortgage Type
New Conventional
Estimated Equity
$562,213
Purchase Details
Closed on
Nov 1, 2000
Sold by
Hearthstone Development Inc
Bought by
Legacy Homes & Development Inc
Home Financials for this Owner
Home Financials are based on the most recent Mortgage that was taken out on this home.
Original Mortgage
$141,600
Interest Rate
7.82%
Mortgage Type
Construction
Create a Home Valuation Report for This Property
The Home Valuation Report is an in-depth analysis detailing your home's value as well as a comparison with similar homes in the area
Home Values in the Area
Average Home Value in this Area
Purchase History
| Date | Buyer | Sale Price | Title Company |
|---|---|---|---|
| Little Cory | -- | None Available | |
| Little Cory | -- | Eagle Pointe Title Insuranc | |
| Legacy Homes & Development Inc | -- | Backman Stewart Title |
Source: Public Records
Mortgage History
| Date | Status | Borrower | Loan Amount |
|---|---|---|---|
| Open | Little Cory | $180,000 | |
| Closed | Legacy Homes & Development Inc | $141,600 |
Source: Public Records
Tax History
| Year | Tax Paid | Tax Assessment Tax Assessment Total Assessment is a certain percentage of the fair market value that is determined by local assessors to be the total taxable value of land and additions on the property. | Land | Improvement |
|---|---|---|---|---|
| 2025 | $2,779 | $299,475 | -- | -- |
| 2024 | $2,779 | $282,865 | $0 | $0 |
| 2023 | $2,846 | $290,400 | $0 | $0 |
| 2022 | $3,011 | $302,170 | $0 | $0 |
| 2021 | $2,548 | $410,200 | $133,800 | $276,400 |
| 2020 | $2,415 | $380,400 | $121,600 | $258,800 |
| 2019 | $2,049 | $330,900 | $100,700 | $230,200 |
| 2018 | $1,853 | $288,300 | $88,100 | $200,200 |
| 2017 | $1,714 | $143,440 | $0 | $0 |
| 2016 | $1,644 | $136,730 | $0 | $0 |
| 2015 | $1,511 | $124,795 | $0 | $0 |
| 2014 | $1,331 | $110,715 | $0 | $0 |
Source: Public Records
Map
Nearby Homes
- 1463 S 260 W
- 802 Brookside Ct
- 1172 S 880 W
- 609 W Saddlebrook Dr
- 613 W Saddlebrook Dr
- 1468 S 910 W
- 1320 S 950 W
- 1631 S Highway 198
- 991 S 930 W
- 1333 S 1050 W
- 1589 S 840 W
- 1338 S 1050 W
- 846 S 880 W
- 1116 W 1290 S
- 1128 W 1150 S Unit 9
- 2003 S 1150 W Unit 1040
- 1146 W 1260 S
- 245 W 1770 S
- 336 E 1330 S
- 1216 S 1150 W Unit 19
- 511 W 1240 S
- 533 W 1240 S
- 533 W 1240 S Unit 42
- 533 W 1240 S Unit 67
- 533 W 1240 S Unit 78
- 533 W 1240 S Unit 77
- 533 W 1240 S Unit 76
- 533 W 1240 S Unit 69
- 533 W 1240 S Unit 64
- 533 W 1240 S Unit 61
- 533 W 1240 S Unit 60
- 533 W 1240 S Unit 54
- 533 W 1240 S Unit 53
- 533 W 1240 S Unit 89
- 477 W 1240 S
- 477 W 1240 S Unit 39
- 512 W 1240 S
- 524 W 1240 S
- 520 W 1240 S
- 601 W 1240 S
Your Personal Tour Guide
Ask me questions while you tour the home.