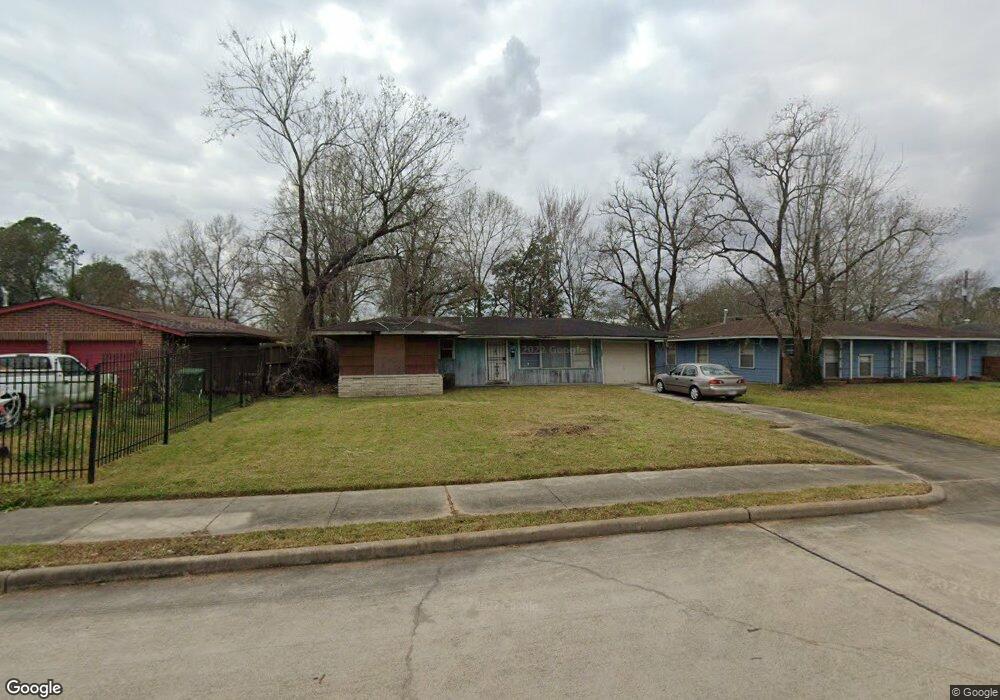
5230 Balkin St Houston, TX 77021
OST-South Union NeighborhoodEstimated Value: $155,482 - $188,000
3
Beds
1
Bath
1,192
Sq Ft
$143/Sq Ft
Est. Value
About This Home
This home is located at 5230 Balkin St, Houston, TX 77021 and is currently estimated at $170,871, approximately $143 per square foot. 5230 Balkin St is a home located in Harris County with nearby schools including Hartsfield Elementary Animal and Environmental Sciences Magnet, Cullen Middle School, and Yates High School.
Create a Home Valuation Report for This Property
The Home Valuation Report is an in-depth analysis detailing your home's value as well as a comparison with similar homes in the area
Home Values in the Area
Average Home Value in this Area
Tax History Compared to Growth
Tax History
| Year | Tax Paid | Tax Assessment Tax Assessment Total Assessment is a certain percentage of the fair market value that is determined by local assessors to be the total taxable value of land and additions on the property. | Land | Improvement |
|---|---|---|---|---|
| 2025 | $2,890 | $126,791 | $78,444 | $48,347 |
| 2024 | $2,890 | $138,104 | $78,444 | $59,660 |
| 2023 | $2,720 | $135,018 | $78,444 | $56,574 |
| 2022 | $2,802 | $120,937 | $71,907 | $49,030 |
| 2021 | $2,564 | $110,005 | $52,296 | $57,709 |
| 2020 | $2,197 | $86,594 | $32,685 | $53,909 |
| 2019 | $2,036 | $76,977 | $27,782 | $49,195 |
| 2018 | $1,519 | $60,033 | $19,611 | $40,422 |
| 2017 | $1,587 | $60,033 | $19,611 | $40,422 |
| 2016 | $1,587 | $60,033 | $19,611 | $40,422 |
| 2015 | $1,425 | $60,033 | $19,611 | $40,422 |
| 2014 | $1,425 | $55,441 | $16,343 | $39,098 |
Source: Public Records
Map
Nearby Homes
- 5244 Enyart St
- 5210 Enyart St
- 5218 Kelso St
- 6527 Beekman Rd
- 5219 Cosby St
- 5259 Perry St
- 5251 Perry St
- 5224 Dewberry St
- 5251 Dewberry St
- 5322 Dewberry St
- 5601 Malmedy Rd
- 5111 Cosby St
- 5107 Gren St
- 4611 Dewberry St
- 5338 Keystone St
- 5022 Balkin St
- 5103 Yellowstone Blvd
- 5023 Cosby St
- 5215 Kingsbury St
- 5941 South Loop E Unit 104