


5230 NE 20th Ave Fort Lauderdale, FL 33308
Knoll Ridge NeighborhoodEstimated payment $5,524/month
Total Views
2,441
3
Beds
2
Baths
1,413
Sq Ft
$565
Price per Sq Ft
Highlights
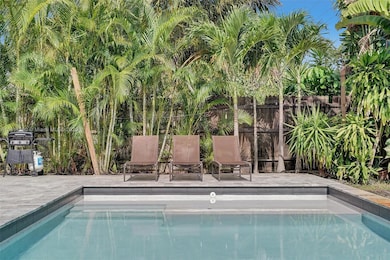
- In Ground Pool
- Sun or Florida Room
- No HOA
- Floranada Elementary School Rated A-
- Pool View
- Clear Impact Glass
About This Home
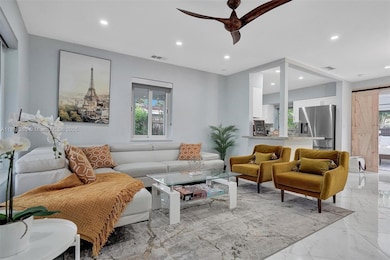
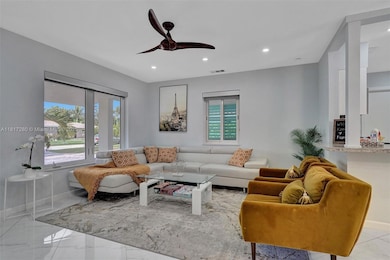
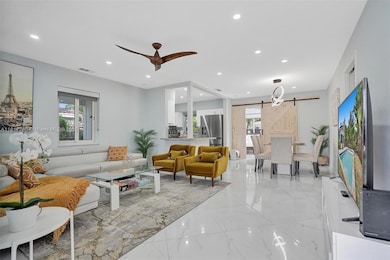
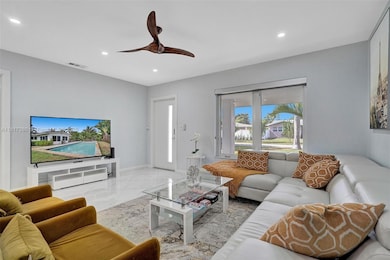
Stunning, recently updated , pool home awaits. Open floor plan with Florida room and spacious backyard featuring pool and shed. Separate laundry room and carport space for 1 car. All new duct work. About 2 miles from the beach. Close to many great restaurants. Furniture negotiable. No HOA.
Home Details
Home Type
- Single Family
Est. Annual Taxes
- $14,450
Year Built
- Built in 1957
Lot Details
- 7,731 Sq Ft Lot
- South Facing Home
- Property is zoned RS-8
Home Design
- Barrel Roof Shape
- Concrete Block And Stucco Construction
Interior Spaces
- 1,413 Sq Ft Home
- 1-Story Property
- Sun or Florida Room
- Pool Views
- Dishwasher
Bedrooms and Bathrooms
- 3 Bedrooms
- 2 Full Bathrooms
Laundry
- Laundry Room
- Dryer
- Washer
Home Security
- Clear Impact Glass
- High Impact Door
Parking
- 1 Carport Space
- Driveway
- Open Parking
Outdoor Features
- In Ground Pool
- Outdoor Grill
Utilities
- Central Heating and Cooling System
Community Details
- No Home Owners Association
- Mary Knoll Subdivision
Listing and Financial Details
- Assessor Parcel Number 494213031170
Map
Create a Home Valuation Report for This Property
The Home Valuation Report is an in-depth analysis detailing your home's value as well as a comparison with similar homes in the area
Home Values in the Area
Average Home Value in this Area
Tax History
| Year | Tax Paid | Tax Assessment Tax Assessment Total Assessment is a certain percentage of the fair market value that is determined by local assessors to be the total taxable value of land and additions on the property. | Land | Improvement |
|---|---|---|---|---|
| 2025 | $14,451 | $743,990 | $77,310 | $666,680 |
| 2024 | $13,694 | $743,990 | $77,310 | $666,680 |
| 2023 | $13,694 | $694,680 | $77,310 | $617,370 |
| 2022 | $13,334 | $688,520 | $77,310 | $611,210 |
| 2021 | $8,321 | $459,200 | $0 | $0 |
| 2020 | $7,068 | $393,440 | $0 | $0 |
| 2019 | $6,698 | $384,600 | $0 | $0 |
| 2018 | $6,338 | $376,210 | $0 | $0 |
| 2017 | $6,147 | $360,000 | $0 | $0 |
| 2016 | $5,616 | $281,340 | $0 | $0 |
| 2015 | $2,126 | $137,670 | $0 | $0 |
| 2014 | $2,141 | $136,580 | $0 | $0 |
| 2013 | -- | $227,810 | $77,310 | $150,500 |
Source: Public Records
Property History
| Date | Event | Price | Change | Sq Ft Price |
|---|---|---|---|---|
| 08/11/2025 08/11/25 | Price Changed | $799,000 | 0.0% | $565 / Sq Ft |
| 06/19/2025 06/19/25 | For Rent | $5,000 | 0.0% | -- |
| 06/06/2025 06/06/25 | For Sale | $830,000 | 0.0% | $587 / Sq Ft |
| 04/03/2024 04/03/24 | Rented | $5,500 | -3.5% | -- |
| 03/26/2024 03/26/24 | Under Contract | -- | -- | -- |
| 03/07/2024 03/07/24 | For Rent | $5,700 | 0.0% | -- |
| 03/06/2024 03/06/24 | Off Market | $5,700 | -- | -- |
| 02/20/2024 02/20/24 | For Rent | $5,700 | 0.0% | -- |
| 02/12/2024 02/12/24 | Off Market | $5,700 | -- | -- |
| 01/31/2024 01/31/24 | For Rent | $5,700 | 0.0% | -- |
| 01/15/2024 01/15/24 | Off Market | $5,700 | -- | -- |
| 12/19/2023 12/19/23 | For Rent | $5,700 | 0.0% | -- |
| 12/11/2023 12/11/23 | Off Market | $5,700 | -- | -- |
| 10/25/2023 10/25/23 | For Rent | $5,700 | 0.0% | -- |
| 10/24/2023 10/24/23 | Off Market | $5,700 | -- | -- |
| 10/18/2023 10/18/23 | Price Changed | $5,700 | -1.7% | $4 / Sq Ft |
| 10/03/2023 10/03/23 | For Rent | $5,800 | 0.0% | -- |
| 10/02/2023 10/02/23 | Off Market | $5,800 | -- | -- |
| 09/22/2023 09/22/23 | For Rent | $5,800 | 0.0% | -- |
| 09/22/2023 09/22/23 | Off Market | $5,800 | -- | -- |
| 09/11/2023 09/11/23 | For Rent | $5,800 | 0.0% | -- |
| 09/11/2023 09/11/23 | Off Market | $5,800 | -- | -- |
| 08/09/2023 08/09/23 | Price Changed | $5,800 | -6.5% | $4 / Sq Ft |
| 07/27/2023 07/27/23 | For Rent | $6,200 | -0.8% | -- |
| 08/23/2021 08/23/21 | Rented | $6,250 | +4.2% | -- |
| 08/06/2021 08/06/21 | For Rent | $6,000 | 0.0% | -- |
| 06/25/2021 06/25/21 | Sold | $649,000 | 0.0% | $459 / Sq Ft |
| 05/03/2021 05/03/21 | For Sale | $649,000 | +26.0% | $459 / Sq Ft |
| 02/14/2020 02/14/20 | Sold | $515,000 | -1.9% | $338 / Sq Ft |
| 01/15/2020 01/15/20 | Pending | -- | -- | -- |
| 01/06/2020 01/06/20 | For Sale | $525,000 | +31.3% | $345 / Sq Ft |
| 11/09/2016 11/09/16 | Sold | $400,000 | -6.8% | $263 / Sq Ft |
| 10/10/2016 10/10/16 | Pending | -- | -- | -- |
| 01/11/2016 01/11/16 | For Sale | $429,000 | -- | $282 / Sq Ft |
Source: MIAMI REALTORS® MLS
Purchase History
| Date | Type | Sale Price | Title Company |
|---|---|---|---|
| Warranty Deed | $649,000 | Attorney | |
| Warranty Deed | $515,000 | None Available | |
| Warranty Deed | $400,000 | None Available | |
| Warranty Deed | $122,000 | -- |
Source: Public Records
Mortgage History
| Date | Status | Loan Amount | Loan Type |
|---|---|---|---|
| Open | $548,750 | New Conventional | |
| Previous Owner | $109,800 | No Value Available |
Source: Public Records
Similar Homes in Fort Lauderdale, FL
Source: MIAMI REALTORS® MLS
MLS Number: A11817280
APN: 49-42-13-03-1170
Disclaimer: Certain information contained herein is derived from information provided by parties other than Homes.com. All information provided is deemed reliable, but is not guaranteed to be accurate and should be independently verified.
![]() IDX information is provided exclusively for personal, non-commercial use, and may not be used for any purpose other than to identify prospective properties consumers may be interested in purchasing. Information is deemed reliable but not guaranteed.
IDX information is provided exclusively for personal, non-commercial use, and may not be used for any purpose other than to identify prospective properties consumers may be interested in purchasing. Information is deemed reliable but not guaranteed.
Nearby Homes
- 2050 NE 53rd St
- 2020 NE 54th St
- 1931 NE 52nd Ct
- 2061 NE 54th St
- 5280 NE 19th Ave
- 2160 NE 53rd St
- 5284 NE 18 Terrace
- 2141 NE 52nd St
- 5284 NE 18th Terrace
- 5409 NE 21st Terrace
- 1950 NE 55th Ct
- 2101 NE 54th Ct
- 2000 NE 51st Ct Unit 205
- 5555 NE 20th Terrace
- 5290 NE 18th Ave
- 2020 NE 56th St Unit 206
- 1910 NE 56th St
- 1801 NE 54th St
- 5131 NE 18th Terrace
- 2170 NE 51st Ct Unit C3
- 5220 NE 19th Ave
- 2201 NE 52nd St
- 1920 NE 51st Ct Unit 209
- 5195 NE 18th Ave Unit 4
- 5141 NE 18th Ave Unit 3
- 2020 NE 56th St Unit 208
- 5111 NE 18th Ave
- 5111 NE 18th Ave
- 1761 NE 52nd St Unit 1-2
- 2291 NE 51st Ct
- 2210 NE 54th St Unit W
- 5451 NE 22nd Ave
- 5510 NE 18th Ave
- 1831 NE 56th St Unit 2
- 1831 NE 56th St Unit 1
- 2130 NE 56th St Unit 1 + 2
- 1821 NE 56th St Unit 1
- 1821 NE 56th St Unit 4
- 1750 NE 56th Ct Unit 5
- 5630 NE 18th Ave Unit 102