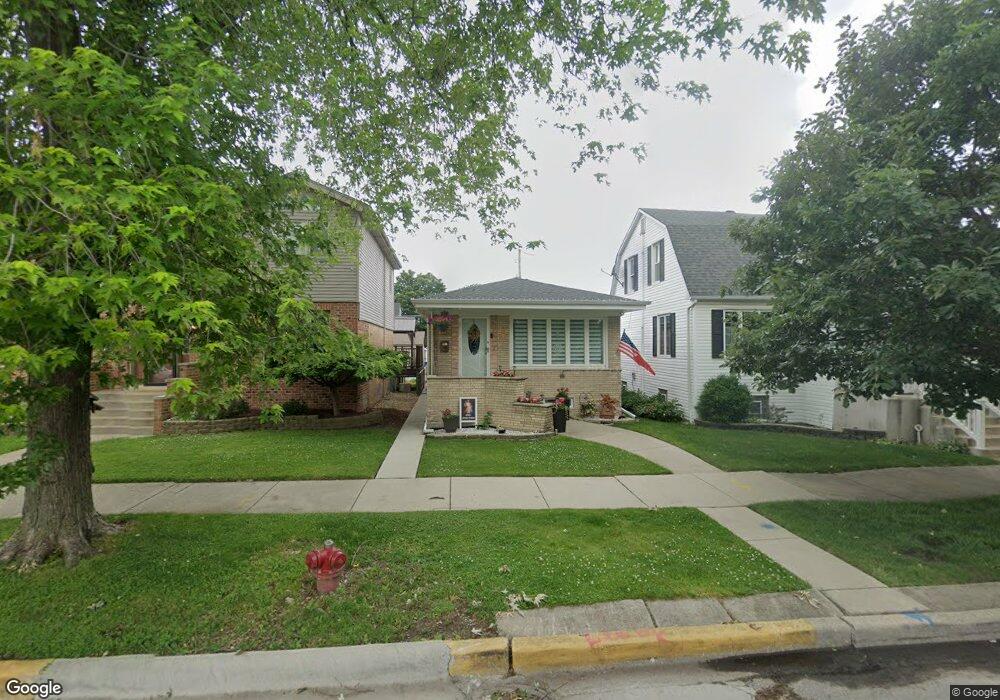
5230 S Meade Ave Chicago, IL 60638
Garfield Ridge NeighborhoodEstimated Value: $335,332 - $405,000
3
Beds
2
Baths
1,144
Sq Ft
$314/Sq Ft
Est. Value
About This Home
This home is located at 5230 S Meade Ave, Chicago, IL 60638 and is currently estimated at $359,083, approximately $313 per square foot. 5230 S Meade Ave is a home located in Cook County with nearby schools including Byrne Elementary School, Kennedy High School, and Gloria Dei Lutheran School.
Ownership History
Date
Name
Owned For
Owner Type
Purchase Details
Closed on
Oct 18, 2018
Sold by
Kaminski Jozef Gal and Galica Anna
Bought by
Galica Henryk and Galica Anna
Current Estimated Value
Purchase Details
Closed on
Jun 11, 2017
Sold by
Gal Kaminski Jozef and Gal Kaminska Anna
Bought by
Gal Kaminski Jr Jozef and Galica Anna
Purchase Details
Closed on
Sep 11, 2000
Sold by
Gonsiorek Teresa
Bought by
Gal Kaminski Jozef and Gal Kaminska Anna
Home Financials for this Owner
Home Financials are based on the most recent Mortgage that was taken out on this home.
Original Mortgage
$136,800
Outstanding Balance
$48,743
Interest Rate
8.37%
Estimated Equity
$310,340
Purchase Details
Closed on
Jul 20, 1994
Sold by
Jakubowski Dennis A
Bought by
Gonsiorek Teresa
Home Financials for this Owner
Home Financials are based on the most recent Mortgage that was taken out on this home.
Original Mortgage
$102,000
Interest Rate
8.41%
Create a Home Valuation Report for This Property
The Home Valuation Report is an in-depth analysis detailing your home's value as well as a comparison with similar homes in the area
Home Values in the Area
Average Home Value in this Area
Purchase History
| Date | Buyer | Sale Price | Title Company |
|---|---|---|---|
| Galica Henryk | -- | None Available | |
| Gal Kaminski Jr Jozef | -- | Attorney | |
| Gal Kaminski Jozef | -- | Ticor Title Insurance | |
| Gonsiorek Teresa | -- | Intercounty Title | |
| Gonsiorek Teresa | -- | Intercounty Title |
Source: Public Records
Mortgage History
| Date | Status | Borrower | Loan Amount |
|---|---|---|---|
| Open | Gal Kaminski Jozef | $136,800 | |
| Previous Owner | Gonsiorek Teresa | $102,000 |
Source: Public Records
Tax History
| Year | Tax Paid | Tax Assessment Tax Assessment Total Assessment is a certain percentage of the fair market value that is determined by local assessors to be the total taxable value of land and additions on the property. | Land | Improvement |
|---|---|---|---|---|
| 2025 | $3,825 | $30,000 | $4,375 | $25,625 |
| 2024 | $3,825 | $30,000 | $4,375 | $25,625 |
| 2023 | $3,691 | $24,000 | $3,906 | $20,094 |
| 2022 | $3,691 | $24,000 | $3,906 | $20,094 |
| 2021 | $1,964 | $23,999 | $3,906 | $20,093 |
| 2020 | $2,040 | $22,839 | $3,125 | $19,714 |
| 2019 | $2,034 | $25,377 | $3,125 | $22,252 |
| 2018 | $2,003 | $25,377 | $3,125 | $22,252 |
| 2017 | $2,145 | $20,205 | $2,812 | $17,393 |
| 2016 | $2,541 | $20,205 | $2,812 | $17,393 |
| 2015 | $2,444 | $20,205 | $2,812 | $17,393 |
| 2014 | $2,424 | $17,780 | $2,656 | $15,124 |
| 2013 | $2,778 | $17,780 | $2,656 | $15,124 |
Source: Public Records
Map
Nearby Homes
- 5115 S Melvina Ave
- 5348 S Merrimac Ave
- 5245 S Mayfield Ave
- 6119 W 55th St
- 5142 S Mulligan Ave
- 6025 W 55th St
- 5235 S Monitor Ave
- 6051 S Archer Ave Unit 3B
- 5850 W 55th St Unit 3F
- 5130 S Menard Ave
- 5255 S Menard Ave
- 5301 S Menard Ave
- 5250 S Nagle Ave
- 5419 S Massasoit Ave Unit 3
- 5227 S Neenah Ave
- 5201 S Neenah Ave
- 5658 S Meade Ave
- 5658 S Austin Ave
- 5611 S Monitor Ave
- 5723 S Melvina Ave
- 5228 S Meade Ave
- 5232 S Meade Ave
- 5232 S Meade Ave
- 5222 S Meade Ave
- 5222 S Meade Ave
- 5236 S Meade Ave
- 5238 S Meade Ave
- 5240 S Meade Ave
- 5240 S Meade Ave
- 5227 S Moody Ave
- 5225 S Moody Ave
- 5233 S Moody Ave
- 5212 S Meade Ave
- 5212 S Meade Ave
- 5221 S Moody Ave
- 5239 S Moody Ave
- 5244 S Meade Ave
- 5215 S Moody Ave
- 5243 S Moody Ave
- 5229 S Meade Ave
Your Personal Tour Guide
Ask me questions while you tour the home.