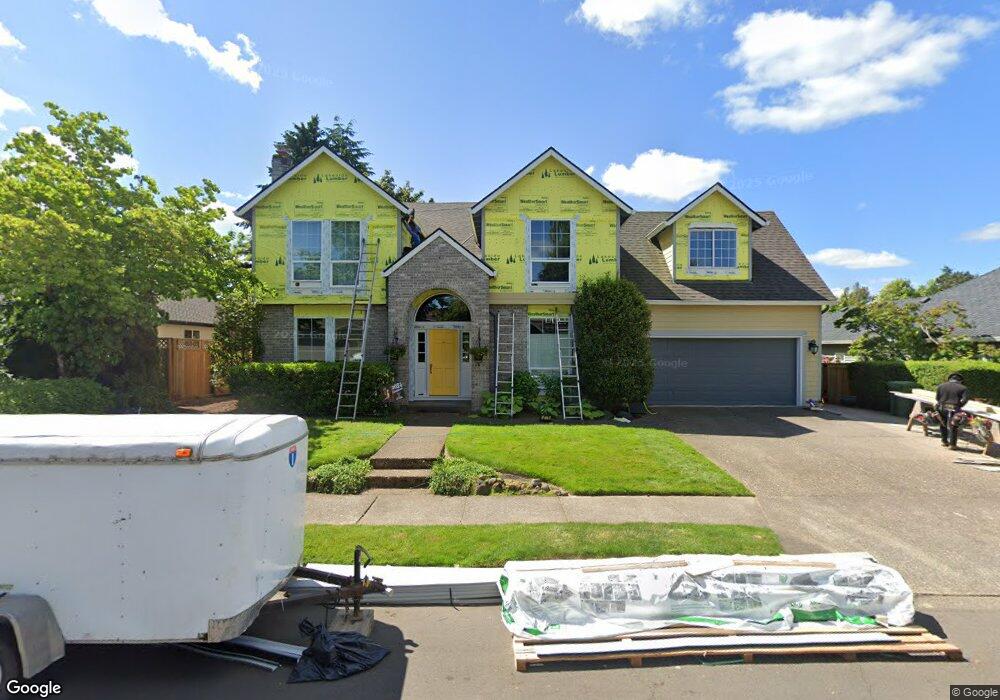
5230 SW Joshua St Tualatin, OR 97062
Tualatin East NeighborhoodEstimated Value: $759,000 - $818,000
4
Beds
3
Baths
3,032
Sq Ft
$258/Sq Ft
Est. Value
About This Home
This home is located at 5230 SW Joshua St, Tualatin, OR 97062 and is currently estimated at $781,171, approximately $257 per square foot. 5230 SW Joshua St is a home located in Clackamas County with nearby schools including Bridgeport Elementary School, Hazelbrook Middle School, and Tualatin High School.
Ownership History
Date
Name
Owned For
Owner Type
Purchase Details
Closed on
May 20, 2005
Sold by
Shapiro Regina L and Shapiro Bret R
Bought by
Shrope Jeffrey and Shrope Brandy
Current Estimated Value
Home Financials for this Owner
Home Financials are based on the most recent Mortgage that was taken out on this home.
Original Mortgage
$311,960
Outstanding Balance
$161,924
Interest Rate
5.87%
Mortgage Type
Fannie Mae Freddie Mac
Estimated Equity
$619,247
Purchase Details
Closed on
Apr 8, 1998
Sold by
Kleibrink Paul J and Kleibrink Sally Sue
Bought by
Shapiro Bret R and Shapiro Regina L
Home Financials for this Owner
Home Financials are based on the most recent Mortgage that was taken out on this home.
Original Mortgage
$225,000
Interest Rate
7.15%
Purchase Details
Closed on
May 8, 1996
Sold by
Rudolph Matthew E
Bought by
Shapiro Bret R and Shapiro Regina L
Home Financials for this Owner
Home Financials are based on the most recent Mortgage that was taken out on this home.
Original Mortgage
$207,000
Interest Rate
7.8%
Create a Home Valuation Report for This Property
The Home Valuation Report is an in-depth analysis detailing your home's value as well as a comparison with similar homes in the area
Home Values in the Area
Average Home Value in this Area
Purchase History
| Date | Buyer | Sale Price | Title Company |
|---|---|---|---|
| Shrope Jeffrey | $389,950 | Transnation Title Agency Or | |
| Shapiro Bret R | -- | First American Title Ins Co | |
| Shapiro Bret R | $260,000 | Ticor Title Insurance |
Source: Public Records
Mortgage History
| Date | Status | Borrower | Loan Amount |
|---|---|---|---|
| Open | Shrope Jeffrey | $311,960 | |
| Previous Owner | Shapiro Bret R | $225,000 | |
| Previous Owner | Shapiro Bret R | $207,000 | |
| Closed | Shrope Jeffrey | $38,995 |
Source: Public Records
Tax History Compared to Growth
Tax History
| Year | Tax Paid | Tax Assessment Tax Assessment Total Assessment is a certain percentage of the fair market value that is determined by local assessors to be the total taxable value of land and additions on the property. | Land | Improvement |
|---|---|---|---|---|
| 2025 | $8,743 | $455,918 | -- | -- |
| 2024 | $7,952 | $442,639 | -- | -- |
| 2023 | $7,952 | $429,747 | $0 | $0 |
| 2022 | $7,415 | $417,231 | $0 | $0 |
| 2021 | $7,148 | $405,079 | $0 | $0 |
| 2020 | $6,872 | $393,281 | $0 | $0 |
| 2019 | $6,700 | $381,827 | $0 | $0 |
| 2018 | $6,431 | $370,706 | $0 | $0 |
| 2017 | $5,930 | $359,909 | $0 | $0 |
| 2016 | $5,634 | $349,426 | $0 | $0 |
| 2015 | $5,422 | $339,249 | $0 | $0 |
| 2014 | $5,113 | $329,368 | $0 | $0 |
Source: Public Records
Map
Nearby Homes
- 5275 SW Greenwood Cir
- 5393 SW Wichita St
- 19130 SW 51st Ave
- 20102 SW 54th Terrace
- 19200 SW 46th Ave
- 5736 SW Natchez St
- 5707 SW Sequoia Dr
- 19368 Riverwood Ln
- 19222 Benfield Ave
- 19973 SW 62nd Terrace
- 18978 Arrowwood Ave
- 3990 SW Borland Rd
- 4201 Childs Rd
- 18863 Indian Springs Rd
- 19060 Terry Ave
- 3777 Rivers Edge Dr
- 19787 SW 67th Ave
- 4123 Chad Dr
- 19778 SW 68th Ave
- 18434 Sandpiper Cir
- 5200 SW Joshua St
- 5270 SW Joshua St
- 5065 SW Relisted
- 5065 SW Greenwood-Relisted
- 19550 SW 53rd Ave
- 5065 SW Greenwood Cir
- 19600 SW 53rd Ave
- 5055 SW Greenwood Cir
- 5255 SW Joshua St
- 5180 SW Joshua St
- 5285 SW Joshua St
- 5195 SW Joshua St
- 5045 SW Greenwood Cir
- 5322 SW Joshua St
- 5301 SW Joshua St
- 5140 SW Joshua St
- 5240 SW Natchez St
- 19525 SW 53rd Ave
- 5060 SW Greenwood Cir
- 5220 SW Natchez St