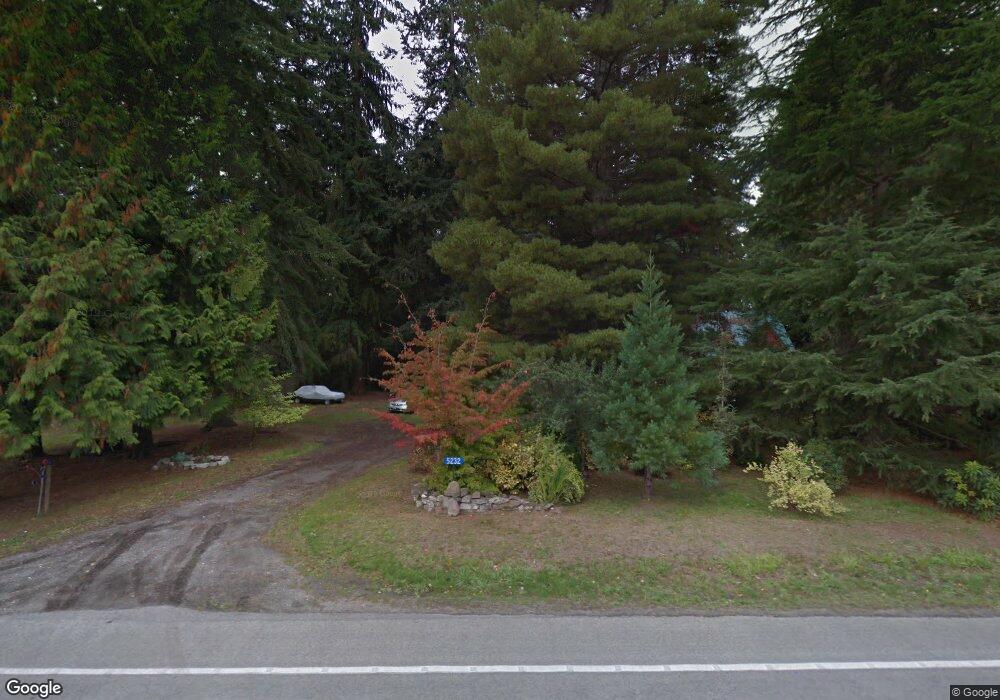
5232 Langley Rd Langley, WA 98260
Estimated Value: $697,931 - $881,000
3
Beds
2
Baths
2,197
Sq Ft
$368/Sq Ft
Est. Value
About This Home
This home is located at 5232 Langley Rd, Langley, WA 98260 and is currently estimated at $809,233, approximately $368 per square foot. 5232 Langley Rd is a home located in Island County with nearby schools including South Whidbey Elementary School, South Whidbey Middle School, and South Whidbey High School.
Ownership History
Date
Name
Owned For
Owner Type
Purchase Details
Closed on
Oct 3, 2024
Sold by
Mchugh Thomas O
Bought by
Mchugh Denise F
Current Estimated Value
Purchase Details
Closed on
Sep 15, 2008
Sold by
Mchugh Denise
Bought by
Mchugh Thomas O and Mchugh Denise F
Purchase Details
Closed on
Sep 11, 2008
Sold by
Masson Patricia S
Bought by
Mchugh Denise
Purchase Details
Closed on
Mar 21, 2005
Sold by
Sepessy Stephen and Masson Patricia Stevenlyn
Bought by
Sepessy Stephen and The Revocable Living Tr Of Ste
Create a Home Valuation Report for This Property
The Home Valuation Report is an in-depth analysis detailing your home's value as well as a comparison with similar homes in the area
Home Values in the Area
Average Home Value in this Area
Purchase History
| Date | Buyer | Sale Price | Title Company |
|---|---|---|---|
| Mchugh Denise F | $313 | None Listed On Document | |
| Mchugh Thomas O | -- | None Available | |
| Mchugh Denise | -- | None Available | |
| Sepessy Stephen | -- | -- |
Source: Public Records
Tax History
| Year | Tax Paid | Tax Assessment Tax Assessment Total Assessment is a certain percentage of the fair market value that is determined by local assessors to be the total taxable value of land and additions on the property. | Land | Improvement |
|---|---|---|---|---|
| 2025 | $794 | $555,927 | $310,000 | $245,927 |
| 2024 | $3,588 | $550,009 | $300,000 | $250,009 |
| 2023 | $3,588 | $544,091 | $290,000 | $254,091 |
| 2022 | $3,063 | $503,769 | $270,000 | $233,769 |
| 2021 | $2,747 | $381,495 | $175,000 | $206,495 |
| 2020 | $2,583 | $348,286 | $165,000 | $183,286 |
| 2019 | $2,374 | $335,986 | $200,000 | $135,986 |
| 2018 | $2,404 | $306,532 | $170,000 | $136,532 |
| 2017 | $2,212 | $287,628 | $150,000 | $137,628 |
| 2016 | $1,877 | $289,819 | $150,000 | $139,819 |
| 2015 | $1,863 | $237,009 | $95,000 | $142,009 |
| 2013 | -- | $250,303 | $114,750 | $135,553 |
Source: Public Records
Map
Nearby Homes
- 5180 Camelot Ct
- 4311 Lunberg St
- 7 xx Sandy Point Rd
- 0 S Hodges Ave
- 0 XXX Sandy Point Rd
- 4336 Meander Ln
- 5474 Wilkinson Rd
- 1043 Village Loop
- 808 Woodsong Ln
- 4985 Wilkinson Rd
- 321 Edgecliff Dr
- 313 Edgecliff Dr
- 5051 Waterside Ln
- 4773 Whale Walk
- 5477 Wilkinson Rd
- 566 Creekside Terrace Unit 101
- 11652 State Route 525
- 424 Island View Ln
- 0 XXX Coles Rd
- 683 3rd St Unit 1(A)
Your Personal Tour Guide
Ask me questions while you tour the home.