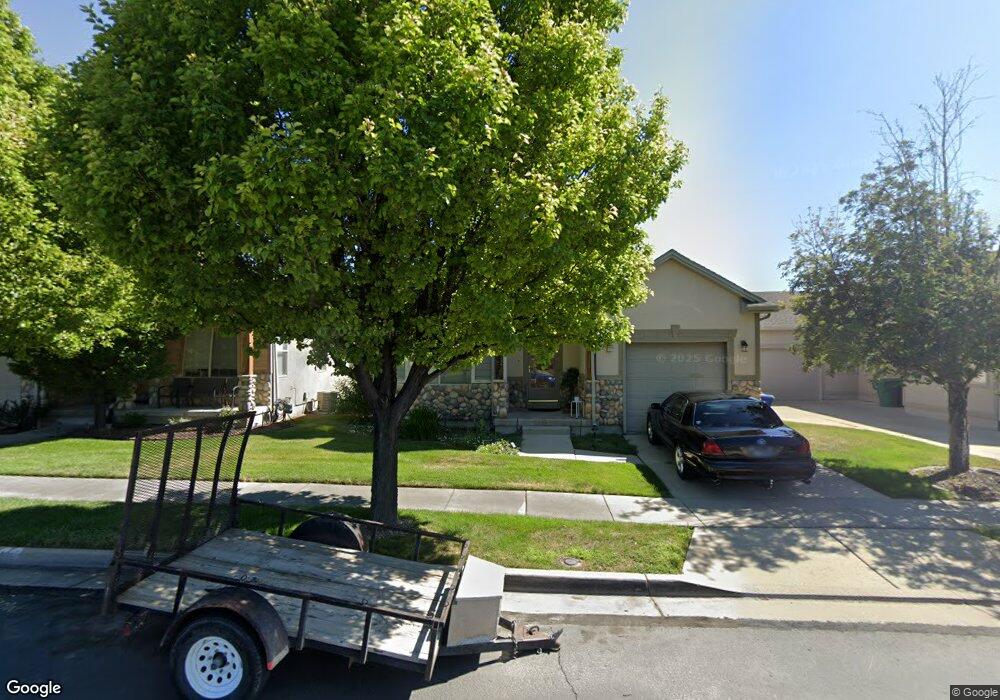
5232 Ranches Loop Rd Unit 203 West Jordan, UT 84081
Cobble Creek NeighborhoodEstimated Value: $446,000 - $524,000
2
Beds
2
Baths
2,740
Sq Ft
$178/Sq Ft
Est. Value
About This Home
This home is located at 5232 Ranches Loop Rd Unit 203, West Jordan, UT 84081 and is currently estimated at $488,791, approximately $178 per square foot. 5232 Ranches Loop Rd Unit 203 is a home located in Salt Lake County with nearby schools including Hayden Peak Elementary School, West Hills Middle School, and Copper Hills High School.
Ownership History
Date
Name
Owned For
Owner Type
Purchase Details
Closed on
Oct 2, 2014
Sold by
Butler Properties Llc
Bought by
Butler Capital Llc
Current Estimated Value
Purchase Details
Closed on
Sep 29, 2014
Sold by
Hansen Judy L
Bought by
Butler Properties Llc
Purchase Details
Closed on
May 5, 2008
Sold by
Hansen Judy L and Butterfield Dean L
Bought by
Hansen Judy L
Home Financials for this Owner
Home Financials are based on the most recent Mortgage that was taken out on this home.
Original Mortgage
$205,030
Interest Rate
5.8%
Mortgage Type
New Conventional
Purchase Details
Closed on
Apr 7, 2005
Sold by
Island Park Development Llc
Bought by
Rice Alan Scott
Purchase Details
Closed on
Sep 10, 2004
Sold by
The Ranches At Stone Creek Llc
Bought by
Hansen Judy L
Home Financials for this Owner
Home Financials are based on the most recent Mortgage that was taken out on this home.
Original Mortgage
$170,950
Interest Rate
5.12%
Mortgage Type
Unknown
Create a Home Valuation Report for This Property
The Home Valuation Report is an in-depth analysis detailing your home's value as well as a comparison with similar homes in the area
Home Values in the Area
Average Home Value in this Area
Purchase History
| Date | Buyer | Sale Price | Title Company |
|---|---|---|---|
| Butler Capital Llc | -- | Accommodation | |
| Butler Properties Llc | $202,600 | Integrated Title Ins Svcs | |
| Hansen Judy L | -- | Bonneville Superior Title | |
| Rice Alan Scott | -- | Integrated Title Ins Svcs | |
| Hansen Judy L | -- | Integrated Title Ins Svcs |
Source: Public Records
Mortgage History
| Date | Status | Borrower | Loan Amount |
|---|---|---|---|
| Previous Owner | Hansen Judy L | $205,030 | |
| Previous Owner | Hansen Judy L | $170,950 |
Source: Public Records
Tax History Compared to Growth
Tax History
| Year | Tax Paid | Tax Assessment Tax Assessment Total Assessment is a certain percentage of the fair market value that is determined by local assessors to be the total taxable value of land and additions on the property. | Land | Improvement |
|---|---|---|---|---|
| 2025 | $2,604 | $503,200 | $117,400 | $385,800 |
| 2024 | $2,604 | $501,000 | $112,900 | $388,100 |
| 2023 | $2,503 | $453,800 | $108,600 | $345,200 |
| 2022 | $2,621 | $467,600 | $106,400 | $361,200 |
| 2021 | $2,195 | $356,500 | $81,900 | $274,600 |
| 2020 | $2,087 | $318,100 | $75,300 | $242,800 |
| 2019 | $2,058 | $307,500 | $71,100 | $236,400 |
| 2018 | $1,900 | $281,600 | $71,100 | $210,500 |
| 2017 | $1,825 | $269,400 | $71,100 | $198,300 |
| 2016 | $1,642 | $227,700 | $74,600 | $153,100 |
| 2015 | $1,616 | $218,500 | $83,300 | $135,200 |
| 2014 | $1,577 | $209,900 | $80,800 | $129,100 |
Source: Public Records
Map
Nearby Homes
- 5189 W Dove Creek Ln
- 5183 W Swift Water Way
- 5298 W Icehouse Way
- 7908 Cold Stone Ln Unit N3
- 5422 W Island Creek Dr
- 4976 W Wood Spring Dr
- 8453 S Windmill Dr
- 7903 Mckenzie Ln
- 7886 Mckenzie Ln
- 4678 Emmons Dr
- 7563 S Opal Mountain Way W Unit 306
- 7568 S Opal Mountain Way W Unit 316
- 7567 S Opal Mountain Way W Unit 307
- 7556 S Opal Mountain Way W Unit 311
- 7569 S Opal Mountain Way W Unit 308
- 7554 S Opal Mountain Way W Unit 310
- 7564 S Opal Mountain Way W Unit 314
- 7553 S Opal Mountain Way W Unit 302
- 7973 S Nebo Dr
- 6916 S Static Peak Dr
- 5232 Ranches Loop Rd
- 5238 Ranches Loop Rd
- 5238 W Ranches Loop Rd
- 5228 Ranches Loop Rd
- 5246 Ranches Loop Rd
- 5222 Ranches Loop Rd
- 5217 Swift Water Way
- 5217 Swift Water Way Unit 103
- 5217 W Swift Water Way
- 5213 Swift Water Way
- 5213 Swift Water Way Unit 104
- 5223 W Swift Water Way
- 5223 Swift Water Way
- 5223 Swift Water Way Unit 102
- 5229 Swift Water Way
- 5229 W Swift Water Way
- 5207 Swift Water Way
- 5207 Swift Water Way Unit 105
- 5207 W Swift Water Way
- 5218 W Ranches Loop Rd