M
Seller's Agent in 2014
Marsha Barron
Marsha Barron Real Estate, Inc
(972) 625-1986
2 in this area
4 Total Sales
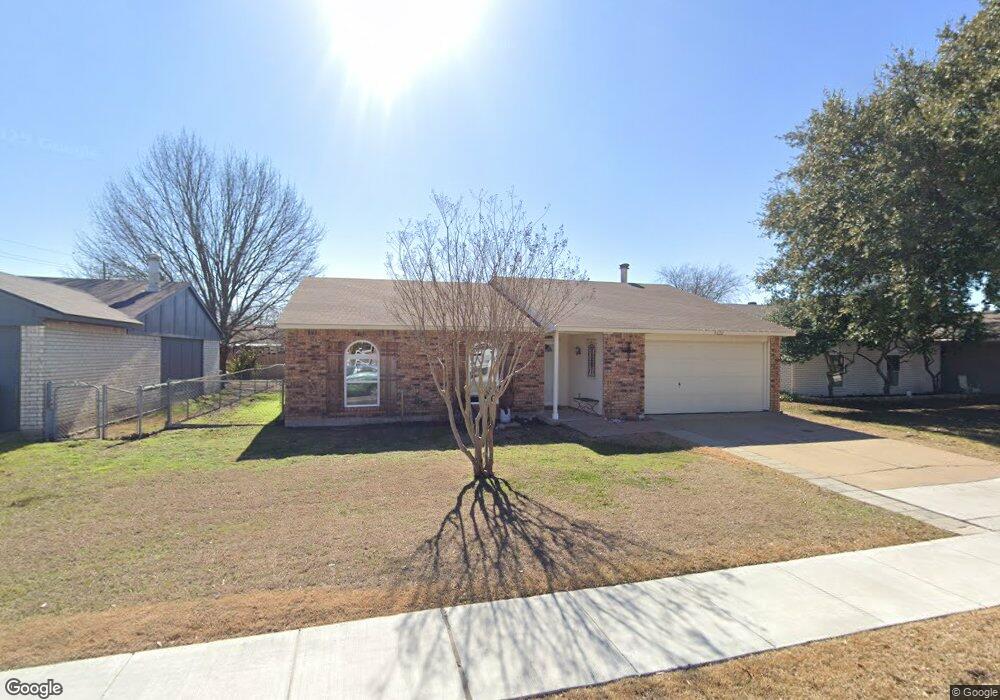
Estimated Value: $301,089 - $327,000
THREE BEDROOM 2 BATH 1.5 GARAGE, CEILING FANS IN EACH BEDROOM. TENANTS MUST HAVE GOOD RENTAL HISTORY AND PAYMENT HISTOREY. WE WILL DO THE PAPERWORK. $50 APP FEE PER ADULT PAYABLE TO MARSHA BARRON. $500.00 PET FEE. $1050.00 DEPOSIT AND $1050 RENT IN CASHIERS CHECK . VERY CLOSE TO 121 AND PAIGE. THIS HOUSE WILL BE READY FOR MOVE-IN BY MOVE IN DATE. TENANT VACATING, AND CLEANING IN PROGRESS.
| Date | Event | Price | List to Sale | Price per Sq Ft |
|---|---|---|---|---|
| 01/22/2014 01/22/14 | Rented | $1,050 | 0.0% | -- |
| 12/23/2013 12/23/13 | Under Contract | -- | -- | -- |
| 12/04/2013 12/04/13 | For Rent | $1,050 | -- | -- |
| Year | Tax Paid | Tax Assessment Tax Assessment Total Assessment is a certain percentage of the fair market value that is determined by local assessors to be the total taxable value of land and additions on the property. | Land | Improvement |
|---|---|---|---|---|
| 2025 | $5,085 | $227,000 | $71,300 | $155,700 |
| 2024 | $5,085 | $262,000 | $71,300 | $190,700 |
| 2023 | $5,408 | $276,000 | $57,040 | $218,960 |
| 2022 | $4,849 | $231,000 | $57,040 | $173,960 |
| 2021 | $4,210 | $189,000 | $47,415 | $141,585 |
| 2020 | $3,756 | $169,000 | $47,415 | $121,585 |
| 2019 | $3,443 | $150,000 | $47,415 | $102,585 |
| 2018 | $3,119 | $135,000 | $47,415 | $87,585 |
| 2017 | $2,780 | $119,000 | $36,363 | $82,637 |
| 2016 | $2,570 | $110,000 | $36,363 | $73,637 |
| 2015 | $2,276 | $100,000 | $22,131 | $77,869 |
| 2013 | -- | $90,200 | $24,385 | $65,815 |
M
Seller's Agent in 2014
Marsha Barron
Marsha Barron Real Estate, Inc
(972) 625-1986
2 in this area
4 Total Sales
