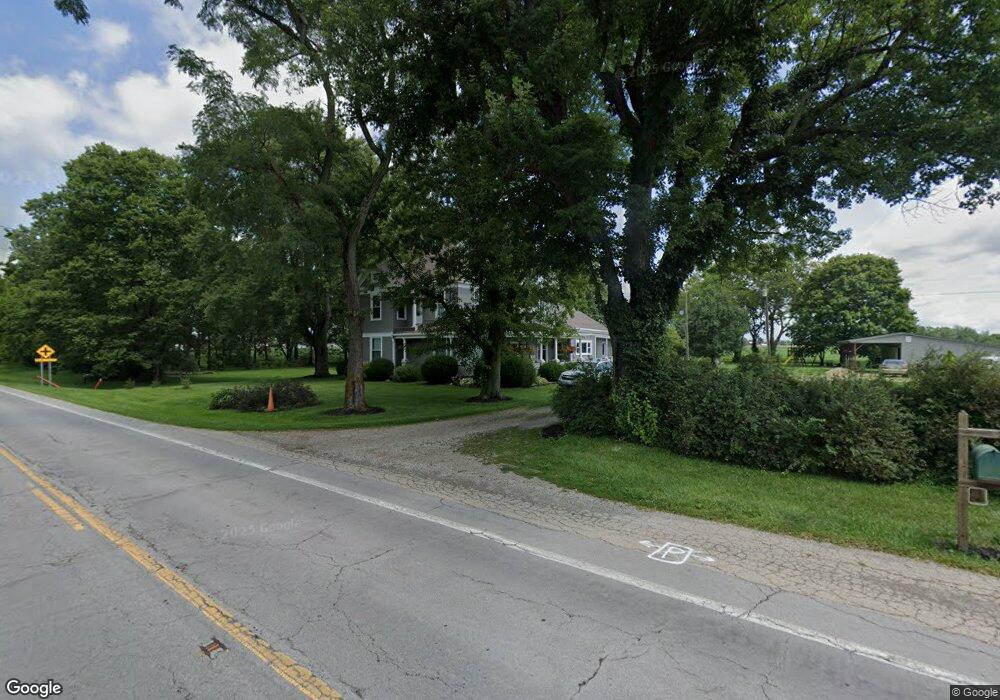
5232 State Route 122 S West Alexandria, OH 45381
Estimated Value: $362,000 - $431,766
5
Beds
2
Baths
2,777
Sq Ft
$145/Sq Ft
Est. Value
About This Home
This home is located at 5232 State Route 122 S, West Alexandria, OH 45381 and is currently estimated at $402,922, approximately $145 per square foot. 5232 State Route 122 S is a home located in Preble County with nearby schools including Twin Valley South Elementary School, Twin Valley South Middle School, and Twin Valley South High School.
Ownership History
Date
Name
Owned For
Owner Type
Purchase Details
Closed on
Sep 13, 2022
Sold by
Selby Douglas F
Bought by
Selby Paul Robert and Selby Peter Eben
Current Estimated Value
Purchase Details
Closed on
Jul 2, 2010
Sold by
Selby Douglas F and Selby Martha A
Bought by
Selby Douglas F and Revoc Martha A Selby
Purchase Details
Closed on
Oct 31, 1995
Sold by
Wright Paul A
Bought by
Selby Douglas F and Selby Martha A
Home Financials for this Owner
Home Financials are based on the most recent Mortgage that was taken out on this home.
Original Mortgage
$85,000
Interest Rate
7.65%
Mortgage Type
New Conventional
Create a Home Valuation Report for This Property
The Home Valuation Report is an in-depth analysis detailing your home's value as well as a comparison with similar homes in the area
Home Values in the Area
Average Home Value in this Area
Purchase History
| Date | Buyer | Sale Price | Title Company |
|---|---|---|---|
| Selby Paul Robert | $333 | Northwest Title Family Of Comp | |
| Selby Douglas F | $333 | Northwest Title Family Of Comp | |
| Selby Douglas F | -- | None Available | |
| Selby Douglas F | $145,000 | -- |
Source: Public Records
Mortgage History
| Date | Status | Borrower | Loan Amount |
|---|---|---|---|
| Previous Owner | Selby Douglas F | $85,000 |
Source: Public Records
Tax History Compared to Growth
Tax History
| Year | Tax Paid | Tax Assessment Tax Assessment Total Assessment is a certain percentage of the fair market value that is determined by local assessors to be the total taxable value of land and additions on the property. | Land | Improvement |
|---|---|---|---|---|
| 2024 | $2,427 | $99,510 | $41,650 | $57,860 |
| 2023 | $2,427 | $99,510 | $41,650 | $57,860 |
| 2022 | $1,802 | $57,460 | $14,300 | $43,160 |
| 2021 | $1,953 | $77,270 | $34,110 | $43,160 |
| 2020 | $1,871 | $77,270 | $34,110 | $43,160 |
| 2019 | $2,026 | $75,230 | $32,490 | $42,740 |
| 2018 | $2,097 | $75,230 | $32,490 | $42,740 |
| 2017 | $1,991 | $75,230 | $32,490 | $42,740 |
| 2016 | $1,929 | $66,740 | $28,170 | $38,570 |
| 2014 | $1,908 | $69,270 | $28,180 | $41,090 |
| 2013 | $1,793 | $64,960 | $23,870 | $41,090 |
Source: Public Records
Map
Nearby Homes
- 6394 E Carlton Rd
- 1568 Wolf Rd
- 3292 Twin Creek Rd
- 4801 Fisher Twin Rd
- 1389 Leon Dr
- 759 Barnetts Mill Rd
- 177 Sample Rd
- 6171 Somers Gratis Rd
- 37 Smith St
- 61 Central Ave
- 99 Katherine Dr
- 325 Chestnut Dr
- 335 Frizzell Ave
- 813 Cypress Ln
- The Aspen House Plan at Meadowbrook Estates
- The Rowan House Plan at Meadowbrook Estates
- The Heath House Plan at Meadowbrook Estates
- The Sequoia House Plan at Meadowbrook Estates
- The Linden House Plan at Meadowbrook Estates
- The Reed II House Plan at Meadowbrook Estates
- 5006 State Route 122 S
- 4257 Carlton Rd
- 5738 State Route 122 S
- 5001 State Route 122 S
- 5006 St Rt 122
- 5001 St Rt 122
- 3700 Quaker Trace Rd
- 0 Quaker Trace Rd Unit 752688
- 0 Quaker Trace Rd Unit 1421567
- 0 Quaker Trace Rd Unit 1421566
- 0 Quaker Trace Rd Unit 594388
- 0 Quaker Trace Rd Unit 594387
- 4440 Quaker Trace Rd
- 5786 State Route 122 S
- 3674 Quaker Trace Rd
- 5787 S St Rt 122
- 3598 Quaker Trace Rd
- 0-0 Quaker Trace Rd
- 3576 Quaker Trace Rd
- 4775 State Route 122 S