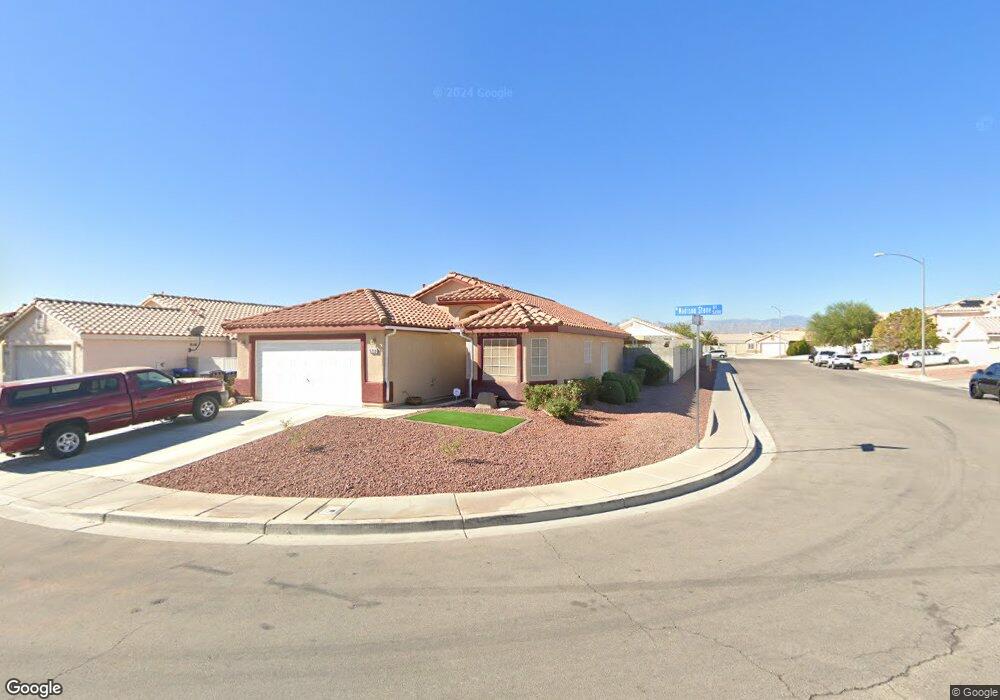
5233 Madison Stone St North Las Vegas, NV 89081
Northridge NeighborhoodEstimated Value: $399,523 - $415,000
4
Beds
2
Baths
1,624
Sq Ft
$251/Sq Ft
Est. Value
About This Home
This home is located at 5233 Madison Stone St, North Las Vegas, NV 89081 and is currently estimated at $406,841, approximately $250 per square foot. 5233 Madison Stone St is a home located in Clark County with nearby schools including Jesse D. Scott Elementary School, Clifford O. Findlay Middle School, and Mojave High School.
Ownership History
Date
Name
Owned For
Owner Type
Purchase Details
Closed on
Jul 10, 2025
Sold by
Burleson Leticia F
Bought by
Leticia Fuentes Burlesonliving Trust and Burleson
Current Estimated Value
Purchase Details
Closed on
Mar 11, 2013
Sold by
Burleson Leticia F
Bought by
Burleson Leticia F
Home Financials for this Owner
Home Financials are based on the most recent Mortgage that was taken out on this home.
Original Mortgage
$144,149
Interest Rate
3.53%
Mortgage Type
VA
Purchase Details
Closed on
Sep 29, 2003
Sold by
D R Horton Inc
Bought by
Burleson Howard D
Home Financials for this Owner
Home Financials are based on the most recent Mortgage that was taken out on this home.
Original Mortgage
$170,256
Interest Rate
6.17%
Mortgage Type
VA
Purchase Details
Closed on
Sep 24, 2003
Sold by
Burleson Leticia F
Bought by
Burleson Howard D
Home Financials for this Owner
Home Financials are based on the most recent Mortgage that was taken out on this home.
Original Mortgage
$170,256
Interest Rate
6.17%
Mortgage Type
VA
Create a Home Valuation Report for This Property
The Home Valuation Report is an in-depth analysis detailing your home's value as well as a comparison with similar homes in the area
Home Values in the Area
Average Home Value in this Area
Purchase History
| Date | Buyer | Sale Price | Title Company |
|---|---|---|---|
| Leticia Fuentes Burlesonliving Trust | -- | None Listed On Document | |
| Burleson Leticia F | -- | Title Services Of Nevada | |
| Burleson Howard D | $166,918 | United Title Of Nevada | |
| Burleson Howard D | -- | United Title Of Nevada |
Source: Public Records
Mortgage History
| Date | Status | Borrower | Loan Amount |
|---|---|---|---|
| Previous Owner | Burleson Leticia F | $144,149 | |
| Previous Owner | Burleson Howard D | $170,256 |
Source: Public Records
Tax History Compared to Growth
Tax History
| Year | Tax Paid | Tax Assessment Tax Assessment Total Assessment is a certain percentage of the fair market value that is determined by local assessors to be the total taxable value of land and additions on the property. | Land | Improvement |
|---|---|---|---|---|
| 2025 | $461 | $110,372 | $32,900 | $77,472 |
| 2024 | $456 | $110,372 | $32,900 | $77,472 |
| 2023 | $456 | $103,150 | $31,150 | $72,000 |
| 2022 | $538 | $90,326 | $24,500 | $65,826 |
| 2021 | $522 | $85,508 | $23,100 | $62,408 |
| 2020 | $463 | $84,867 | $23,100 | $61,767 |
| 2019 | $488 | $79,927 | $19,250 | $60,677 |
| 2018 | $522 | $64,894 | $15,050 | $49,844 |
| 2017 | $1,354 | $59,777 | $14,000 | $45,777 |
| 2016 | $429 | $45,935 | $10,500 | $35,435 |
| 2015 | $305 | $42,978 | $8,050 | $34,928 |
| 2014 | $295 | $29,863 | $5,250 | $24,613 |
Source: Public Records
Map
Nearby Homes
- 5217 Grand Lake St
- 1408 Laughing Larkspur Ave
- 1808 Luxor Lights Ave
- 5116 Blue Rose St
- 5440 Aladdin Dream St
- 5253 Pendergrass St
- 1113 Cypress Falls Ct
- 5220 Pendergrass St
- 5025 Blue Rose St
- 1109 Jewel Springs Ln
- 1113 E Hammer Ln
- 1817 Cosmo Star Ave
- 1214 Emerald Stone Ave
- 2117 Leatherbridge Ct
- 1602 Morning Bell Ave
- 5528 Oatfield St
- 1413 Fantastic Ct
- 1405 Fantastic Ct
- 1014 Emerald Stone Ave
- 2213 Dale Bumpers Ct
- 5225 Madison Stone St
- 1808 Fawn Hedge Ave
- 5232 Painted Pebble St
- 1804 Fawn Hedge Ave
- 5228 Painted Pebble St
- 1812 Fawn Hedge Ave
- 1716 Fawn Hedge Ave
- 5221 Madison Stone St
- 5232 Madison Stone St
- 5224 Painted Pebble St
- 5228 Madison Stone St
- 5236 Madison Stone St
- 1712 Fawn Hedge Ave
- 5224 Madison Stone St
- 1816 Fawn Hedge Ave
- 5220 Painted Pebble St
- 5217 Madison Stone St
- 5220 Madison Stone St
- 1708 Fawn Hedge Ave