Estimated Value: $374,000 - $403,000
5
Beds
2
Baths
1,055
Sq Ft
$370/Sq Ft
Est. Value
About This Home
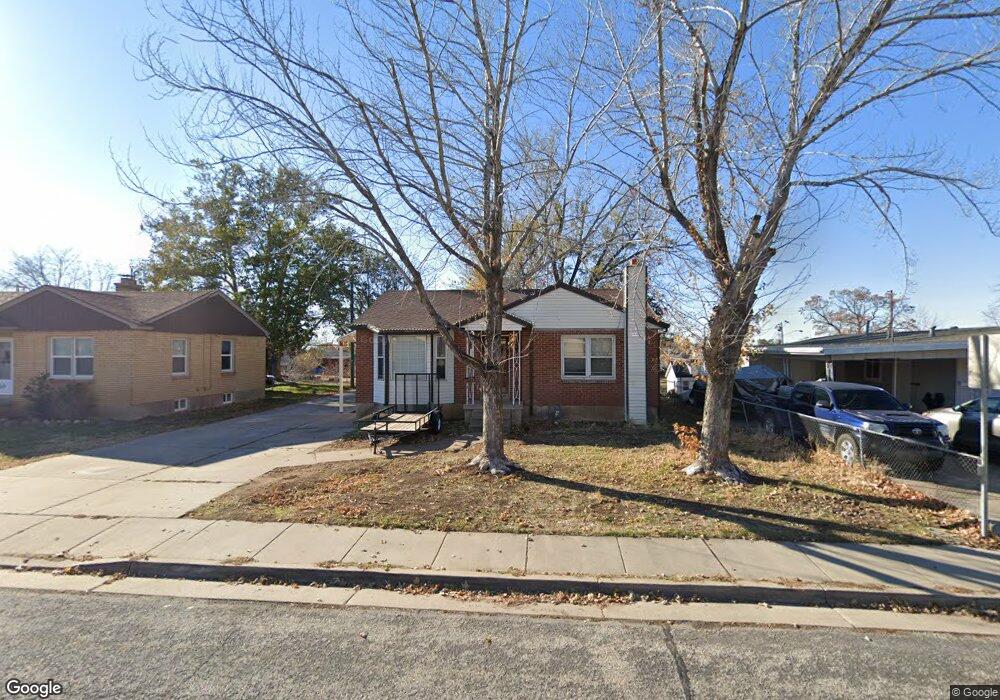
This home is located at 5233 S 2200 W, Roy, UT 84067 and is currently estimated at $390,738, approximately $370 per square foot. 5233 S 2200 W is a home located in Weber County with nearby schools including Lakeview Elementary School, Roy Junior High School, and Roy High School.
Ownership History
Date
Name
Owned For
Owner Type
Purchase Details
Closed on
Nov 1, 2018
Sold by
Jorgensen Paul H and Jorgensen Holly E
Bought by
Jorgensen Paul
Current Estimated Value
Home Financials for this Owner
Home Financials are based on the most recent Mortgage that was taken out on this home.
Original Mortgage
$121,500
Outstanding Balance
$106,616
Interest Rate
4.7%
Mortgage Type
New Conventional
Estimated Equity
$284,122
Purchase Details
Closed on
Dec 12, 2016
Bought by
Jorgensen Paul H
Home Financials for this Owner
Home Financials are based on the most recent Mortgage that was taken out on this home.
Original Mortgage
$120,000
Interest Rate
4.13%
Purchase Details
Closed on
Feb 19, 2016
Sold by
Jorgenxen Vickle
Bought by
Jorgensen Vickie
Create a Home Valuation Report for This Property
The Home Valuation Report is an in-depth analysis detailing your home's value as well as a comparison with similar homes in the area
Home Values in the Area
Average Home Value in this Area
Purchase History
| Date | Buyer | Sale Price | Title Company |
|---|---|---|---|
| Jorgensen Paul | -- | Accommodation | |
| Jorgensen Paul H | -- | -- | |
| Jorgensen Vickie | -- | None Available | |
| Jorgensen Vickie Lee | -- | None Available |
Source: Public Records
Mortgage History
| Date | Status | Borrower | Loan Amount |
|---|---|---|---|
| Open | Jorgensen Paul | $121,500 | |
| Closed | Jorgensen Paul H | $120,000 | |
| Closed | Jorgensen Paul H | -- |
Source: Public Records
Tax History Compared to Growth
Tax History
| Year | Tax Paid | Tax Assessment Tax Assessment Total Assessment is a certain percentage of the fair market value that is determined by local assessors to be the total taxable value of land and additions on the property. | Land | Improvement |
|---|---|---|---|---|
| 2025 | $2,486 | $391,694 | $117,172 | $274,522 |
| 2024 | $2,426 | $211,748 | $64,445 | $147,303 |
| 2023 | $2,133 | $184,250 | $61,979 | $122,271 |
| 2022 | $2,197 | $196,350 | $54,213 | $142,137 |
| 2021 | $1,877 | $276,000 | $68,740 | $207,260 |
| 2020 | $1,756 | $237,001 | $68,740 | $168,261 |
| 2019 | $1,645 | $208,000 | $38,966 | $169,034 |
| 2018 | $1,507 | $178,000 | $34,100 | $143,900 |
| 2017 | $1,439 | $159,000 | $34,100 | $124,900 |
| 2016 | $1,343 | $79,324 | $15,766 | $63,558 |
| 2015 | $1,306 | $79,323 | $15,766 | $63,557 |
| 2014 | $1,317 | $79,324 | $15,766 | $63,558 |
Source: Public Records
Map
Nearby Homes
- 5140 S 2175 W
- 5261 S 2200 W
- 2266 W 5100 S
- 5289 S 2200 W
- 5185 S 2100 W
- 5333 S 2200 W
- 5140 S 2100 W
- 2179 W 4975 S
- 5345 S 2425 W
- 2184 W 5500 S
- 5326 S 2675 W
- 5024 S 2575 W
- 2411 W 4900 S
- 4848 S 2125 W
- 2153 W 4800 S
- 5573 S 2150 W
- 5545 S 2100 W Unit 12
- 5545 S 2100 W Unit 20
- 5545 S 2100 W Unit D22
- 2146 W 5600 S Unit 29