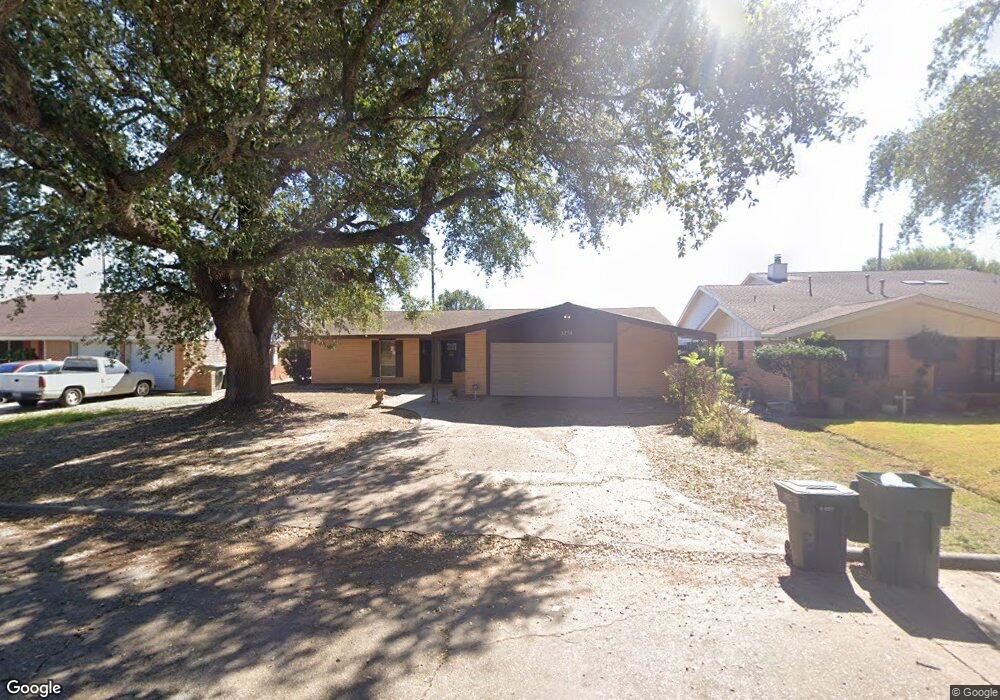
5234 Lakeside Dr Port Arthur, TX 77642
Estimated Value: $164,000 - $189,000
--
Bed
--
Bath
2,245
Sq Ft
$81/Sq Ft
Est. Value
About This Home
This home is located at 5234 Lakeside Dr, Port Arthur, TX 77642 and is currently estimated at $180,811, approximately $80 per square foot. 5234 Lakeside Dr is a home located in Jefferson County with nearby schools including Travis Elementary School, Jefferson Middle School, and Memorial High School.
Ownership History
Date
Name
Owned For
Owner Type
Purchase Details
Closed on
May 23, 2022
Sold by
Jessie Jack Jr
Bought by
Rodriguez-Rodriguez Alfonso and Rodriguez-Fonseca Damaris
Current Estimated Value
Home Financials for this Owner
Home Financials are based on the most recent Mortgage that was taken out on this home.
Original Mortgage
$150,000
Outstanding Balance
$142,497
Interest Rate
5.25%
Mortgage Type
Seller Take Back
Estimated Equity
$38,314
Purchase Details
Closed on
Oct 31, 2008
Sold by
Jack Jessie and The Estate Of Gean Ella Jack
Bought by
Jack Jessie and Jack Adrian
Purchase Details
Closed on
Aug 20, 2004
Sold by
Banco Popular North America
Bought by
Jarquin Denmar G and Jarquin Valentina I
Home Financials for this Owner
Home Financials are based on the most recent Mortgage that was taken out on this home.
Original Mortgage
$33,500
Interest Rate
6%
Mortgage Type
Purchase Money Mortgage
Create a Home Valuation Report for This Property
The Home Valuation Report is an in-depth analysis detailing your home's value as well as a comparison with similar homes in the area
Home Values in the Area
Average Home Value in this Area
Purchase History
| Date | Buyer | Sale Price | Title Company |
|---|---|---|---|
| Rodriguez-Rodriguez Alfonso | -- | Chicago Title | |
| Jack Jessie | -- | None Available | |
| Jarquin Denmar G | -- | -- |
Source: Public Records
Mortgage History
| Date | Status | Borrower | Loan Amount |
|---|---|---|---|
| Open | Rodriguez-Rodriguez Alfonso | $150,000 | |
| Previous Owner | Jarquin Denmar G | $33,500 | |
| Closed | Rodriguez-Rodriguez Alfonso | $30,000 |
Source: Public Records
Tax History Compared to Growth
Tax History
| Year | Tax Paid | Tax Assessment Tax Assessment Total Assessment is a certain percentage of the fair market value that is determined by local assessors to be the total taxable value of land and additions on the property. | Land | Improvement |
|---|---|---|---|---|
| 2025 | $5,322 | $190,232 | $9,940 | $180,292 |
| 2024 | $5,322 | $185,780 | $5,488 | $180,292 |
| 2023 | $5,322 | $185,780 | $5,488 | $180,292 |
| 2022 | $4,150 | $130,675 | $0 | $0 |
| 2021 | $3,937 | $159,199 | $5,488 | $153,711 |
| 2020 | $0 | $107,995 | $5,488 | $102,507 |
| 2019 | $2,706 | $98,240 | $5,490 | $92,750 |
| 2018 | $0 | $98,240 | $5,490 | $92,750 |
| 2017 | $0 | $98,240 | $5,490 | $92,750 |
| 2016 | $2,706 | $92,370 | $5,490 | $86,880 |
| 2015 | -- | $92,370 | $5,490 | $86,880 |
| 2014 | -- | $97,190 | $5,490 | $91,700 |
Source: Public Records
Map
Nearby Homes
- 5228 Lakeside Dr
- 5240 Lakeside Dr
- 5250 Lakeside Dr
- 5222 Lakeside Dr
- 5231 Lakeside Dr
- 5239 Lakeside Dr
- 5210 Lakeside Dr
- 5247 Lakeside Dr
- 5219 Lakeside Dr
- 5253 Lakeside Dr
- 5215 Lakeside Dr
- 5236 Lakeshore Dr
- 5222 Lakeshore Dr
- 5242 Lakeshore Dr
- 5220 Lakeshore Dr
- 5206 Lakeside Dr
- 5248 Lakeshore Dr
- 5257 Lakeside Dr
- 5209 Lakeside Dr
- 5218 Lakeshore Dr