Estimated Value: $101,942 - $260,000
Studio
--
Bath
780
Sq Ft
$200/Sq Ft
Est. Value
About This Home
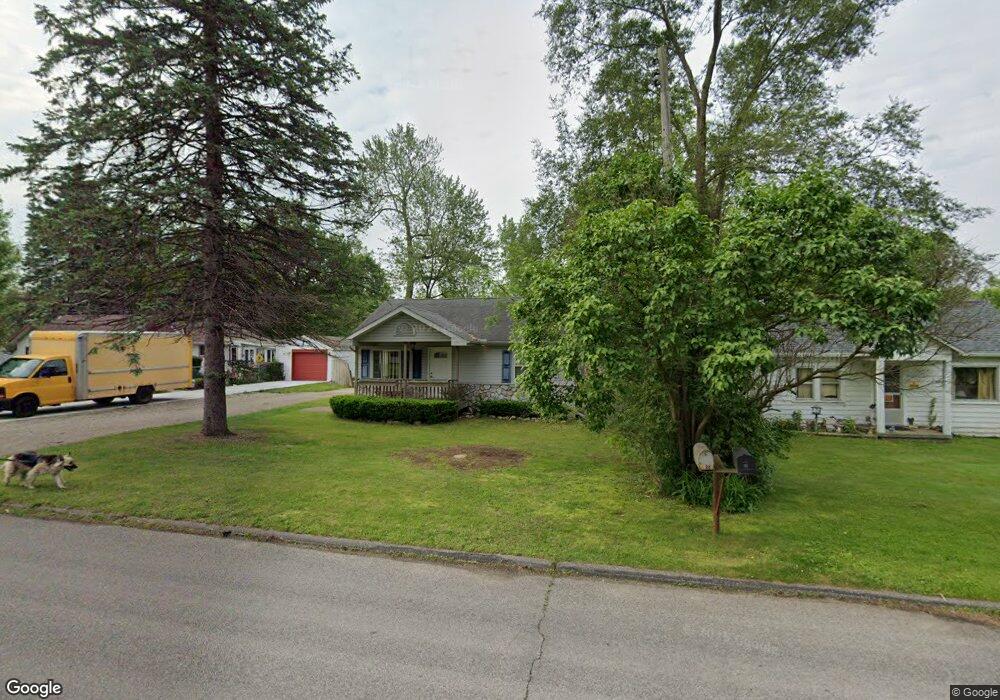
This home is located at 5234 Roberts Dr, Flint, MI 48506 and is currently estimated at $155,736, approximately $199 per square foot. 5234 Roberts Dr is a home located in Genesee County with nearby schools including Weston Elementary School, Leota Fiedler Elementary School, and Kate Dowdall Elementary School.
Ownership History
Date
Name
Owned For
Owner Type
Purchase Details
Closed on
Jul 7, 2023
Sold by
Clementz Barbara J
Bought by
Clementz David A and Clement Hunter D
Current Estimated Value
Purchase Details
Closed on
Apr 7, 2021
Sold by
Clementz Barbara and Clementz Charles
Bought by
Clementz Barbara J and Barbara J Clementz Trust
Purchase Details
Closed on
Apr 17, 2003
Sold by
Clementz David Allen
Bought by
Clementz Charles and Clementz Barbara
Home Financials for this Owner
Home Financials are based on the most recent Mortgage that was taken out on this home.
Original Mortgage
$39,000
Interest Rate
5.86%
Mortgage Type
Purchase Money Mortgage
Purchase Details
Closed on
Mar 23, 2001
Sold by
Marilyn J Kindermann Trust
Bought by
Clementz David Allen
Purchase Details
Closed on
Feb 4, 1998
Sold by
Taxvest Ltd Partnership
Bought by
Kindermann Marilyn G
Create a Home Valuation Report for This Property
The Home Valuation Report is an in-depth analysis detailing your home's value as well as a comparison with similar homes in the area
Home Values in the Area
Average Home Value in this Area
Purchase History
| Date | Buyer | Sale Price | Title Company |
|---|---|---|---|
| Clementz David A | -- | None Listed On Document | |
| Clementz Barbara J | -- | None Available | |
| Clementz Barbara J | -- | None Listed On Document | |
| Clementz Charles | -- | Metropolitan Title Company | |
| Clementz David Allen | $32,000 | Sargents Title Company | |
| Kindermann Marilyn G | $2,100 | -- |
Source: Public Records
Mortgage History
| Date | Status | Borrower | Loan Amount |
|---|---|---|---|
| Previous Owner | Clementz Charles | $39,000 |
Source: Public Records
Tax History
| Year | Tax Paid | Tax Assessment Tax Assessment Total Assessment is a certain percentage of the fair market value that is determined by local assessors to be the total taxable value of land and additions on the property. | Land | Improvement |
|---|---|---|---|---|
| 2025 | $1,343 | $42,700 | $0 | $0 |
| 2024 | $213 | $41,900 | $0 | $0 |
| 2023 | $203 | $39,500 | $0 | $0 |
| 2022 | $1,054 | $34,900 | $0 | $0 |
| 2021 | $1,048 | $32,000 | $0 | $0 |
| 2020 | $186 | $31,000 | $0 | $0 |
| 2019 | $183 | $30,000 | $0 | $0 |
| 2018 | $1,011 | $26,700 | $0 | $0 |
| 2017 | $983 | $26,000 | $0 | $0 |
| 2016 | $1,616 | $25,000 | $0 | $0 |
| 2015 | $774 | $23,700 | $0 | $0 |
| 2014 | $169 | $20,500 | $0 | $0 |
| 2012 | -- | $14,100 | $14,100 | $0 |
Source: Public Records
Map
Nearby Homes
- 5067 Paro Dr
- 4455 N Genesee Rd
- 4452 Muriel Dr
- 4489 Home Town Dr Unit 32
- 4465 Market Place
- 4459 Market Place
- 4453 Market Place
- 4441 Market Place
- 4435 Market Place
- 0000 Home Town Dr
- 4425 Market Place
- 4414 Market Place
- 4417 Market Place
- 5131 E Carpenter Rd
- 4044 N Genesee Rd
- 6161 Finch Ln
- 0 Sugar Maple Farms Unit 50195365
- 6076 E Carpenter Rd
- 4413 Esta Dr
- 6054 E Pierson Rd
- 5240 Roberts Dr
- 5228 Roberts Dr
- 5250 Roberts Dr
- 5210 Roberts Dr
- 5258 Roberts Dr
- 5200 Roberts Dr
- 5270 Roberts Dr
- 5192 Roberts Dr
- 5184 Roberts Dr
- 5274 Roberts Dr
- 5178 Roberts Dr
- 5286 Roberts Dr
- 5168 Roberts Dr
- 5300 Roberts Dr
- 5237 Roberts Dr
- 5225 Roberts Dr
- 5251 Roberts Dr
- 5158 Roberts Dr
- 5211 Roberts Dr
- 5259 Roberts Dr
Your Personal Tour Guide
Ask me questions while you tour the home.