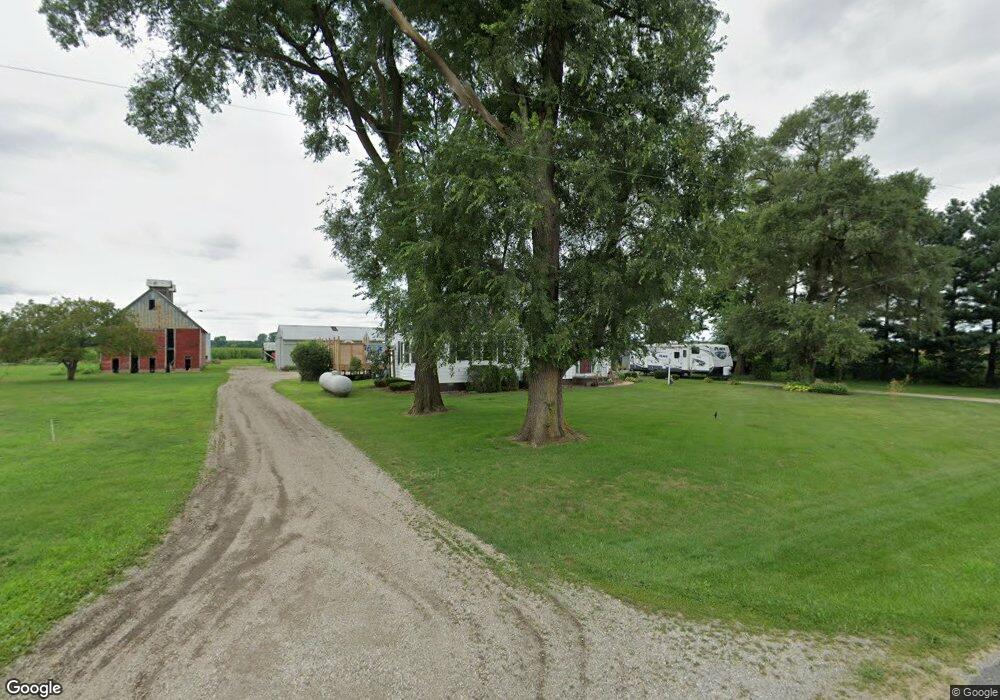
5235 N 300 E Hamlet, IN 46532
Estimated Value: $205,000 - $275,929
2
Beds
2
Baths
1,944
Sq Ft
$123/Sq Ft
Est. Value
About This Home
This home is located at 5235 N 300 E, Hamlet, IN 46532 and is currently estimated at $238,482, approximately $122 per square foot. 5235 N 300 E is a home located in Starke County with nearby schools including Oregon-Davis Elementary School and Oregon-Davis Junior/Senior High School.
Ownership History
Date
Name
Owned For
Owner Type
Purchase Details
Closed on
Jul 14, 2014
Sold by
Orr Robert C
Bought by
Orr Gregg R and Orr Becky L
Current Estimated Value
Home Financials for this Owner
Home Financials are based on the most recent Mortgage that was taken out on this home.
Original Mortgage
$114,400
Interest Rate
4.15%
Mortgage Type
Future Advance Clause Open End Mortgage
Purchase Details
Closed on
Jul 9, 2014
Sold by
Orr April L
Bought by
Orr Gregg R and Orr Becky L
Home Financials for this Owner
Home Financials are based on the most recent Mortgage that was taken out on this home.
Original Mortgage
$114,400
Interest Rate
4.15%
Mortgage Type
Future Advance Clause Open End Mortgage
Purchase Details
Closed on
Jun 16, 2014
Sold by
Orr Tamara K
Bought by
Orr Gregg R and Orr Becky L
Home Financials for this Owner
Home Financials are based on the most recent Mortgage that was taken out on this home.
Original Mortgage
$114,400
Interest Rate
4.15%
Mortgage Type
Future Advance Clause Open End Mortgage
Create a Home Valuation Report for This Property
The Home Valuation Report is an in-depth analysis detailing your home's value as well as a comparison with similar homes in the area
Purchase History
| Date | Buyer | Sale Price | Title Company |
|---|---|---|---|
| Orr Gregg R | -- | Meridian Title Corp | |
| Orr Gregg R | -- | Meridian Title Corp | |
| Orr Gregg R | -- | Meridian Title Corp |
Source: Public Records
Mortgage History
| Date | Status | Borrower | Loan Amount |
|---|---|---|---|
| Closed | Orr Gregg R | $114,400 |
Source: Public Records
Tax History
| Year | Tax Paid | Tax Assessment Tax Assessment Total Assessment is a certain percentage of the fair market value that is determined by local assessors to be the total taxable value of land and additions on the property. | Land | Improvement |
|---|---|---|---|---|
| 2025 | $3,462 | $214,200 | $38,100 | $176,100 |
| 2024 | $3,462 | $208,600 | $36,500 | $172,100 |
| 2023 | $3,292 | $192,800 | $31,400 | $161,400 |
| 2022 | $3,292 | $177,100 | $28,400 | $148,700 |
| 2021 | $3,085 | $149,800 | $25,700 | $124,100 |
| 2020 | $2,899 | $135,000 | $25,500 | $109,500 |
| 2019 | $2,743 | $130,900 | $25,000 | $105,900 |
| 2018 | $2,601 | $126,600 | $24,200 | $102,400 |
| 2017 | $2,356 | $123,400 | $23,300 | $100,100 |
| 2016 | $2,232 | $119,600 | $23,100 | $96,500 |
| 2014 | $1,036 | $119,200 | $22,800 | $96,400 |
| 2013 | $930 | $117,400 | $21,900 | $95,500 |
Source: Public Records
Map
Nearby Homes
- 202 S Jefferson St
- 68 S Jefferson St
- 66 S Jefferson St
- 4500 E 300 N
- 109 S Jefferson St
- 0 Cr 600 N
- 101 S Hamlet St
- 205 W Pearl St
- 4170 E 250 N
- 301 N Starke St
- 10 S Mccormick St
- 1615 N 300 E
- 4420 N 700 E
- 100 N Portland St
- 10300 E 150 N
- 18097 S State Road 39
- V/L E 100 N
- 2022 W 1800 S
- 18351 S Sr 39
- 18097 S Sr 39
Your Personal Tour Guide
Ask me questions while you tour the home.