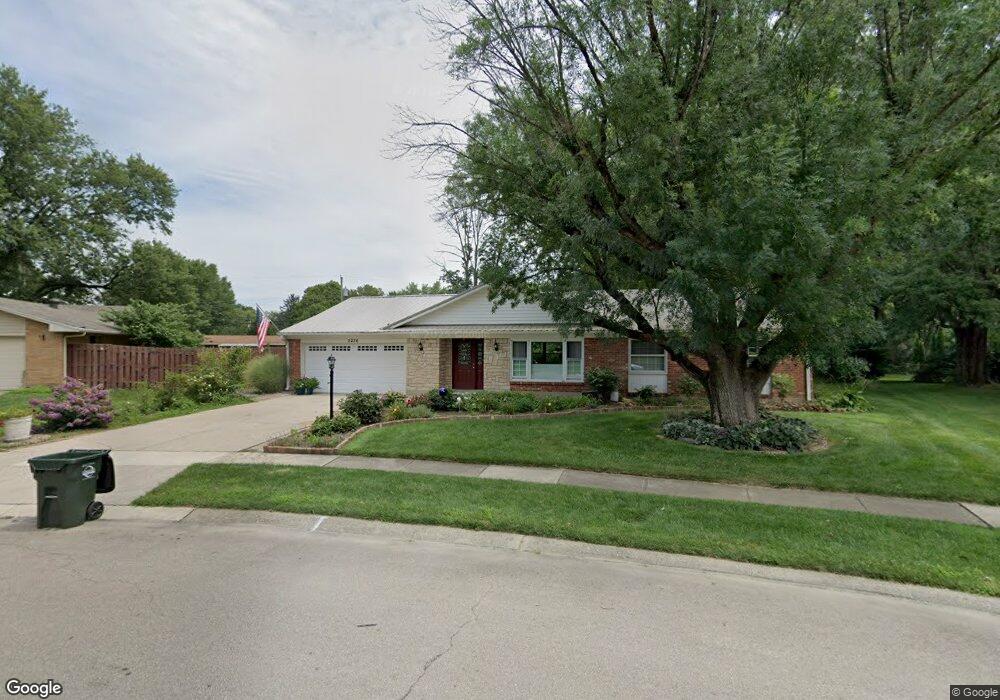
5236 Sugar Maple Dr Dayton, OH 45440
Estimated Value: $305,502 - $342,000
3
Beds
3
Baths
2,076
Sq Ft
$156/Sq Ft
Est. Value
About This Home
This home is located at 5236 Sugar Maple Dr, Dayton, OH 45440 and is currently estimated at $323,376, approximately $155 per square foot. 5236 Sugar Maple Dr is a home located in Montgomery County with nearby schools including John F. Kennedy Elementary School, Kettering Middle School, and Kettering Fairmont High School.
Ownership History
Date
Name
Owned For
Owner Type
Purchase Details
Closed on
May 10, 2010
Sold by
Wildermuth Ducaine M and Wildermuth Mary M
Bought by
Crabb Alison and Crabb Terry A
Current Estimated Value
Home Financials for this Owner
Home Financials are based on the most recent Mortgage that was taken out on this home.
Original Mortgage
$156,723
Outstanding Balance
$105,610
Interest Rate
5.16%
Mortgage Type
FHA
Estimated Equity
$217,766
Purchase Details
Closed on
Jul 31, 2002
Sold by
Phelps Deborah C and Winters Leon
Bought by
Wildermuth Ducaine M and Wildermuth Mary M
Home Financials for this Owner
Home Financials are based on the most recent Mortgage that was taken out on this home.
Original Mortgage
$112,000
Interest Rate
6.7%
Mortgage Type
Purchase Money Mortgage
Purchase Details
Closed on
Dec 4, 2000
Sold by
Estate Of Phyllis E Winters
Bought by
Phelps Deborah C and Winters Leon W
Create a Home Valuation Report for This Property
The Home Valuation Report is an in-depth analysis detailing your home's value as well as a comparison with similar homes in the area
Home Values in the Area
Average Home Value in this Area
Purchase History
| Date | Buyer | Sale Price | Title Company |
|---|---|---|---|
| Crabb Alison | $160,000 | Attorney | |
| Wildermuth Ducaine M | $140,000 | -- | |
| Phelps Deborah C | -- | -- |
Source: Public Records
Mortgage History
| Date | Status | Borrower | Loan Amount |
|---|---|---|---|
| Open | Crabb Alison | $156,723 | |
| Previous Owner | Wildermuth Ducaine M | $112,000 |
Source: Public Records
Tax History Compared to Growth
Tax History
| Year | Tax Paid | Tax Assessment Tax Assessment Total Assessment is a certain percentage of the fair market value that is determined by local assessors to be the total taxable value of land and additions on the property. | Land | Improvement |
|---|---|---|---|---|
| 2024 | $5,305 | $81,350 | $15,930 | $65,420 |
| 2023 | $5,305 | $81,350 | $15,930 | $65,420 |
| 2022 | $5,185 | $62,660 | $12,250 | $50,410 |
| 2021 | $4,816 | $62,660 | $12,250 | $50,410 |
| 2020 | $4,830 | $62,660 | $12,250 | $50,410 |
| 2019 | $4,785 | $54,860 | $12,250 | $42,610 |
| 2018 | $4,809 | $54,860 | $12,250 | $42,610 |
| 2017 | $4,174 | $54,860 | $12,250 | $42,610 |
| 2016 | $3,961 | $48,900 | $12,250 | $36,650 |
| 2015 | $3,783 | $48,900 | $12,250 | $36,650 |
| 2014 | $3,783 | $48,900 | $12,250 | $36,650 |
| 2012 | -- | $49,650 | $12,250 | $37,400 |
Source: Public Records
Map
Nearby Homes
- 5052 Dobbs Dr
- 5324 Oakbrooke Dr
- 5274 Millcreek Rd
- 2386 E Rahn Rd
- 2360 E Rahn Rd
- 2579 Walford Dr
- 2318 E Rahn Rd
- 5310 Glenmina Dr
- 4824 Rean Meadow Dr
- 2184 Broadbent Way
- 2405 Westlawn Dr
- 2925 Walford Dr
- 4901 Wilmington Pike
- 2169 Broadbent Way
- 5891 Overbrooke Rd Unit 5891
- 2236 E Whipp Rd
- 5195 Bigger Rd
- 5335 Glendon Ln
- 5804 Overbrooke Rd
- 2225 Coach Dr Unit F
- 2360 Sugar Maple Dr
- 5224 Sugar Maple Dr
- 5073 Dobbs Dr
- 5079 Dobbs Dr
- 5065 Dobbs Dr
- 2348 Sugar Maple Dr
- 5212 Sugar Maple Dr
- 2373 Acme Ct
- 2361 Sugar Maple Dr
- 2361 Acme Ct
- 2389 Acme Ct
- 2349 Acme Ct
- 5057 Dobbs Dr
- 5213 Sugar Maple Dr
- 2336 Sugar Maple Dr
- 5200 Sugar Maple Dr
- 2349 Sugar Maple Dr
- 5076 Dobbs Dr
- 2337 Acme Ct
- 5068 Dobbs Dr