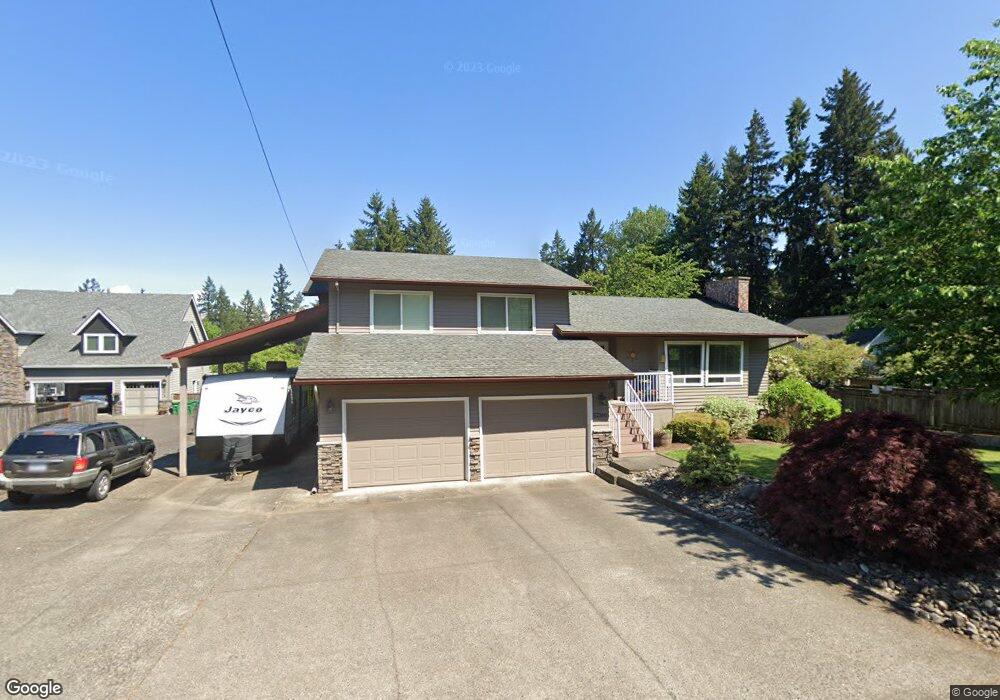
52366 SW Keys Rd Scappoose, OR 97056
Estimated Value: $652,007 - $802,000
4
Beds
3
Baths
1,978
Sq Ft
$369/Sq Ft
Est. Value
About This Home
This home is located at 52366 SW Keys Rd, Scappoose, OR 97056 and is currently estimated at $729,252, approximately $368 per square foot. 52366 SW Keys Rd is a home located in Columbia County with nearby schools including Scappoose High School, South Columbia Family School, and Scappoose Adventist School.
Ownership History
Date
Name
Owned For
Owner Type
Purchase Details
Closed on
Mar 28, 2014
Sold by
Hoag Brian J and Stutsman Hoag Summer D
Bought by
Hanke Darren J and Hanke Tamatha K
Current Estimated Value
Home Financials for this Owner
Home Financials are based on the most recent Mortgage that was taken out on this home.
Original Mortgage
$239,000
Outstanding Balance
$179,996
Interest Rate
4.25%
Mortgage Type
New Conventional
Estimated Equity
$549,256
Purchase Details
Closed on
Aug 8, 2005
Sold by
Hoag Brian and Stutsman Hoag Summer
Bought by
Hoag Brian J and Stutsman Hoag Summer D
Home Financials for this Owner
Home Financials are based on the most recent Mortgage that was taken out on this home.
Original Mortgage
$264,000
Interest Rate
5.48%
Mortgage Type
Stand Alone Refi Refinance Of Original Loan
Create a Home Valuation Report for This Property
The Home Valuation Report is an in-depth analysis detailing your home's value as well as a comparison with similar homes in the area
Home Values in the Area
Average Home Value in this Area
Purchase History
| Date | Buyer | Sale Price | Title Company |
|---|---|---|---|
| Hanke Darren J | $350,000 | Ticor Title | |
| Hoag Brian J | -- | Ticor Title |
Source: Public Records
Mortgage History
| Date | Status | Borrower | Loan Amount |
|---|---|---|---|
| Open | Hanke Darren J | $239,000 | |
| Previous Owner | Hoag Brian J | $264,000 |
Source: Public Records
Tax History Compared to Growth
Tax History
| Year | Tax Paid | Tax Assessment Tax Assessment Total Assessment is a certain percentage of the fair market value that is determined by local assessors to be the total taxable value of land and additions on the property. | Land | Improvement |
|---|---|---|---|---|
| 2025 | $6,126 | $372,030 | $114,030 | $258,000 |
| 2024 | $5,956 | $361,200 | $110,700 | $250,500 |
| 2023 | $5,900 | $350,680 | $110,790 | $239,890 |
| 2022 | $5,651 | $340,470 | $107,570 | $232,900 |
| 2021 | $5,490 | $330,560 | $118,150 | $212,410 |
| 2020 | $5,092 | $320,940 | $112,960 | $207,980 |
| 2019 | $4,959 | $311,600 | $107,830 | $203,770 |
| 2018 | $4,845 | $302,530 | $131,640 | $170,890 |
| 2017 | $4,758 | $293,720 | $127,810 | $165,910 |
| 2016 | $4,698 | $285,170 | $124,090 | $161,080 |
| 2015 | $4,112 | $261,790 | $102,740 | $159,050 |
| 2014 | $4,367 | $276,870 | $89,980 | $186,890 |
Source: Public Records
Map
Nearby Homes
- 32898 SW Keys Landing Way
- 32839 SW Crystal Springs Ct
- 32904 NW View Terrace Place
- 32922 Coal Creek Rd
- 32373 Jp West Rd
- 33344 SW Rokin Way
- 33358 SW Rokin Way
- 33363 SW Rokin Way
- 33374 SW Rokin Way
- 33375 SW Rokin Way
- 33370 SW Rokin Way
- 32952 NW Ridge Dr
- 33399 NW Ej Smith Rd
- 51925 Columbia River Hwy
- 33374 Wickstrom Dr
- 51557 SW Em Watts Rd
- 33298 SW Meadowbrook Dr
- 33279 SW Havlik Dr
- 52866 NE 2nd St
- 33062 Bellcrest Rd
- 52374 SW Keys Rd
- 52386 SW Keys Rd
- 32883 SW Keys Crest Dr
- 52371 SW Keys Rd
- 52328 SW Keys Rd
- 52351 SW Keys Rd
- 52400 SW Keys Rd
- 32880 SW Keys Crest Dr
- 32911 SW Keys Crest Dr
- 52331 SW Keys Rd
- 33010 SW Keys Rd
- 32892 SW Keys Crest Dr
- 52290 SW Keys Rd
- 52411 SW Keys Rd
- 32915 SW Keys Crest Dr
- 52325 SW Keys Rd
- 32908 SW Keys Crest Dr
- 32871 SW Keys Landing
- 32891 SW Keys Landing
- 52305 SW Keys Rd